The Hype Over India’s Solar PV Success is Premature
| AUTHOR | Amit Kumar |
| DATE | August 11, 2026 |
| CATEGORIES | Supply chain HTG Geopolitics Geostrategy China |
Lately, several posts on Chinese social media have emerged praising India’s solar PV manufacturing success. Chinese netizens even drew parallels between India’s surging solar photovoltaic (PV) industry and the Battle of Stalingrad - the legendary World War II turning point where a seemingly invincible fortress was encircled and breached. Indian users on X joined the party.
The hype rests around two broad sets of figures. The first involves India’s photovoltaic module production capacity increasing from less than 10 GW in 2018 to 172 GW in 2026- a 17-fold increase over eight years. The second data point relates to massive overcapacity in China’s solar PV industry, resulting in 11 of the 15 listed Chinese PV companies reporting losses totalling around 50 billion yuan in 2025. ORF’s Antara Ghosal Singh did a piece around this.
So, what’s the story? How incredible are India’s achievements? And how significant is the development? Has the Indian solar PV industry really announced itself on the global stage?
To understand this better, let’s break down the solar PV industry supply chain. It involves four broad segments: polysilicon, ingots and wafers, cells, and modules. One can also add capital goods here - processing and manufacturing equipment used at different stages of the supply chain.
Now, let us look at the comparative numbers for China and India.
Sources:
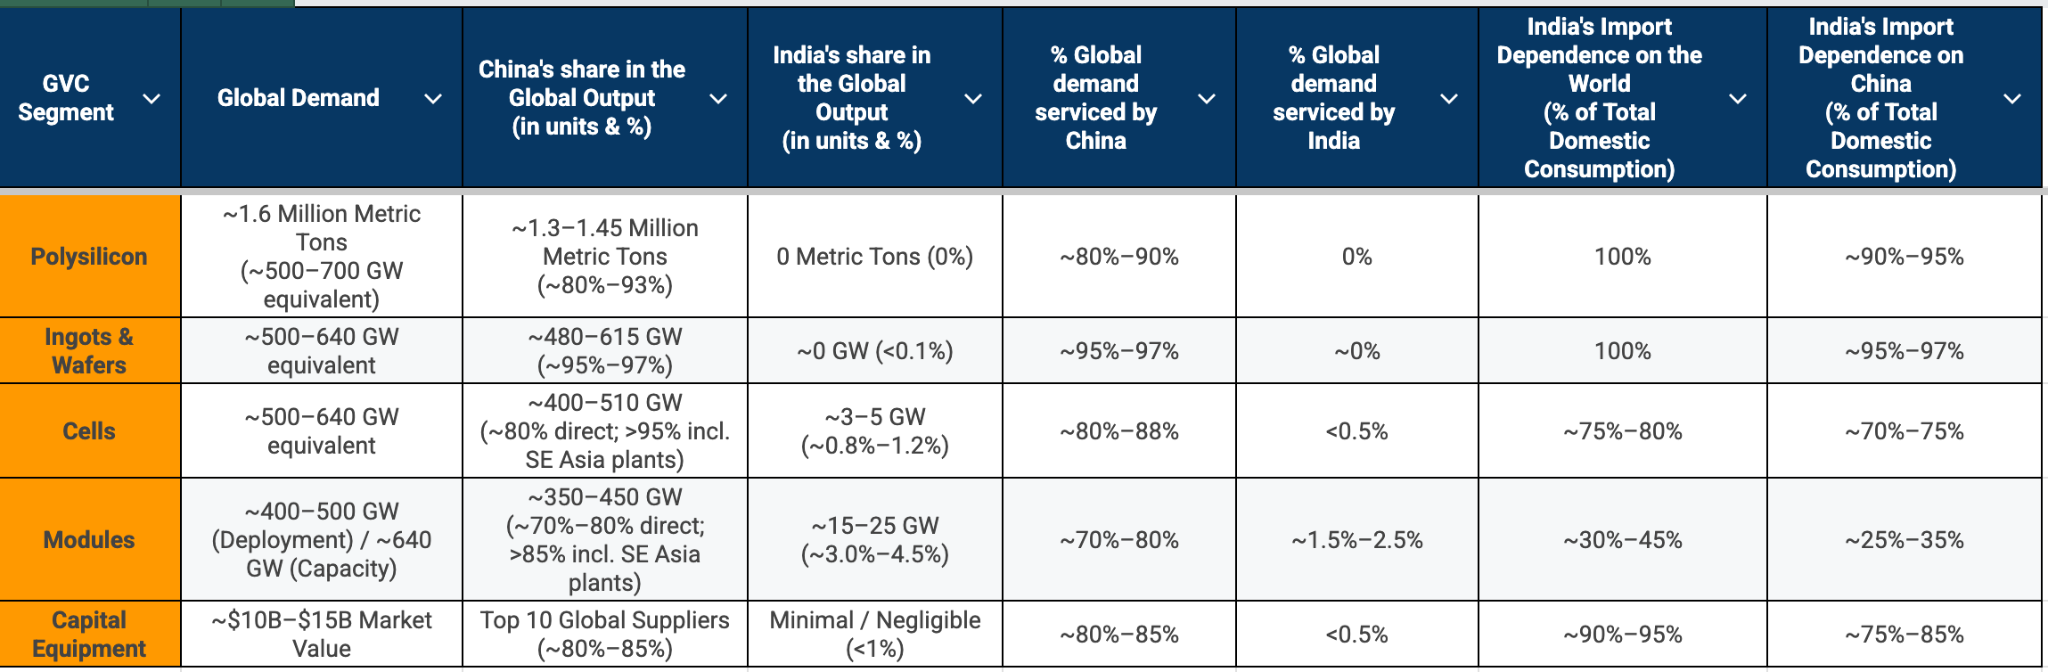
- Global PV installations 664 GW in 2025; global nameplate module capacity ~1,315 GW, Enerdata, Global Solar PV Modules Market Trends 2026, Link
- Global module shipments ~706 GW in 2025, ITRPV / VDMA, 17th edition (via pv magazine USA), Link
- Chinese module exports 267.6 GW in 2025 (+13% YoY); top 4 firms ~58% of 536 GW shipped by listed suppliers, InfoLink Consulting, Link
- China’s domestic solar installations ~315 GW in 2025, aiyangNews, Link
- Global polysilicon production ~1.9m MT in 2025; nameplate capacity >3.2m MT; China ~90% of output, Tianxia Gongchang Research, China Polysilicon 2026, Link
- China ~93–94% of global polysilicon capacity; nine of ten largest producers China-based, Bernreuter Research (via pv magazine), Link
- H1 2025 Chinese polysilicon output 597,000 MT, down 44% YoY; inventory 367,000 MT at end-June 2025, China Nonferrous Metals Industry Association, Silicon Industry Branch (via TaiyangNews), Link
- China >95% of global wafer manufacturing capacity, CEEW, Solar Cell Manufacturing Cost and Supply Chain in India (June 2026), Link
- India cumulative module capacity ~210 GW; cell capacity ~27 GW (December 2025); ALMM List-I 173.1 GW; operational capacity 30–40% below nameplate, Mercom India, State of Solar PV Manufacturing in India 2026 (via pv magazine), Link
- India effective production capacity 50–60 GWp modules, 8–10 GWp cells; wafer capacity 2 GWp, CareEdge Ratings (via pv magazine India), Link
- India module capacity from 3 GW to 172 GW; cell capacity 27 GW (Lok Sabha reply), MNRE / Union Minister Pralhad Joshi (via News on AIR, March 2026), Link
- India imports 98% of wafers, 100% of polysilicon; 2 GW ingot/wafer capacity, Business Today (June 2026), Link
- India cell imports doubled 11 GW to 21 GW, H1 2024 to H1 2025; 52% of growth in Chinese cell exports, Business Today (June 2026), Link
- “74.7% of India’s solar imports from China in Q3 2025; module imports fell 74% YoY”, Mercom India (January 2026) Link
- “India cell import dependence dropped from >90% to 56%; module dependence to 65% (FY2023–24),” Angel One / Rubix (March 2025) Link
- “India wafer imports nearly 100% from China, 2022–2025 trend,”SPF (Sasakawa Peace Foundation) Link
- “India module inventory buildup 29 GW by Q3 2025; capacity >3x domestic demand of ~40 GW,” Wood Mackenzie (October 2025) Link
- Nine leading Chinese firms forecasting combined 2025 losses of RMB43.5–50bn (Tongwei, TCL Zhonghuan, Trina, LONGi, JinkoSolar, JA Solar, Aiko, Junda, Daqo, 华夏能源网 / 荣格工业资源网 (January 2026), Link
- Across 135 listed PV firms in FY2025: 60 loss-making at RMB74.3bn; 75 profitable at RMB56bn, 黑鹰光伏 / 新浪财经 (May 2026), Link
- Upstream polysilicon and wafer producers returned to profit in Q3 2025; module makers remained loss-making, PV Tech (November 2025), Link
- Anti-involution: RMB 50bn fund proposed to retire one-third of Chinese polysilicon capacity, PV Tech (August 2025), Link