Sand Slipping Through Fingers
The Case of China’s Export Controls on Gallium and Germanium
Authors
Executive Summary
China’s weaponisation of its dominance in the production of gallium and germanium between 2023 and 2025 failed to achieve sustained leverage over the US. While Beijing’s restrictive licensing requirements and subsequent blanket ban successfully induced significant price volatility—with international retail benchmarks for high-purity variants appreciating by over 200 per cent—the export controls did not translate into a contraction of the US’ industrial consumption. The assessment reveals that the US’ demonstrated remarkable resilience bolstered by rapid substitutability, supply chain diversification, and even domestic capability building. For gallium, the US successfully pivoted to Japanese, German, and Canadian suppliers, reducing reliance on direct Chinese imports. With respect to Germanium, the US succeeded in insulating itself by relying on diversification, limited domestic production and robust domestic recycling capability.
1. Introduction
As geopolitical contestation between the world’s two largest economies shows no signs of slowing down, export controls have emerged as one of the most preferred tools to compete. In the past three years, both the US and China have resorted to a wide range of export control measures to impose costs on one another and test each other’s resilience.
One such battle was fought over access to gallium and germanium. In July 2023, China imposed export restrictions on the sales of these two elements.1 It imposed licensing requirements on Chinese exporters and tightened end-user controls in an attempt to specifically target the US. The restrictions came into effect from August 1, 2023.2
The decision was significant, given China’s dominance in the production of gallium and germanium and the US’ overwhelming dependence on imports to service its needs. China continues to account for ~99 per cent of the global primary, low-purity gallium (99.99 per cent) production,3 and about 60 per cent of global germanium production.4 This dominance enables Beijing to weaponise the world’s dependence.
Gallium is essential to the manufacturing of certain kinds of semiconductors and optoelectronic devices.5 Germanium, on the other hand, finds application in fibre optics, infrared optics, semiconductor applications, solar cells, and radiation detectors.6 Given their specialised use cases in critical technologies, Beijing hoped to inflict strategic pain on the US.
Building on its previous restrictions, China, on December 3, 2024, further tightened the export controls and imposed a total ban on the sales of gallium and germanium to the US.7 The United States Geological Survey (USGS), in its November 2024 report, estimated that a total ban on exports of gallium and germanium from China could cost the US about $3.4 billion in GDP.8
China finally lifted the ban on November 7, 2025, until November 27, 2026.9 The licensing requirements, however, continue to remain in place.10
Even as the ban stands withdrawn, the impact of China’s restrictions on the US is a useful case study to examine the effectiveness of export restrictions. Two and a half years later, a few questions remain: Did China succeed in inflicting strategic pain on the US? Or did the US manage to weather the impact of export controls?
Answers to these questions can offer insights into China’s preparedness and capability to weaponise trade, and the effectiveness of export controls in meaningfully inflicting sustained pain in the long term.
2. Metrics of Policy Success
To evaluate whether China’s export restrictions succeeded in imposing a punitive cost on the US, the paper examines how three metrics, namely consumption, substitution, and price, varied for each of the two elements in the US.
The primary objective of China’s export restrictions was to create a supply shortage of the two elements, triggering panic among industries dependent on them. Hence, any fluctuation in the US’ consumption of gallium and germanium emerges as the most significant metric to assess China’s policy success. Consequently, the paper examines the long-term consumption trends of the US for both gallium and germanium. If export control measures succeeded in creating a scarcity of supply, i.e. pulling the US’ consumption downwards, relative to previous years, Beijing can claim vindication. Alternatively, if consumption of the two elements fails to show any significant decline, Beijing’s actions could be deemed unsuccessful.
However, it is entirely possible that the US found substitutes for gallium and germanium to compensate for the shortfall in their supply. In that case, a mere reading of its domestic consumption of gallium and germanium will be misleading. Hence, the US’ substitution efforts – both by source and material – become a necessary metric to examine in case US consumption was subdued. If Beijing’s actions manage to drastically reduce consumption without allowing the US’s substitution efforts to succeed, it can claim policy success.
The third and final metric the paper assesses is price variation resulting from China’s export restrictions. If export controls led to a drastic price hike, thereby increasing the economic cost for the US, China could claim success. However, this economic cost has to be read in conjunction with its impact on alternatives. If the surge in prices was complemented by the emergence of additional players, Beijing cannot claim success.
3. Gallium
According to the USGS, the US net import reliance (imports minus exports) as a percentage of its total consumption is 100 per cent.11 It means the US depends entirely on imports to service its domestic demand of gallium.
Generally, the US’ imports of gallium are primarily a mix of gallium metal and gallium arsenide (GaAs) wafers. Further, GaAs, gallium nitride (GaN), and gallium phosphide wafers together accounted for 83 per cent of the total gallium imports in 2024.12 Gallium metal, triethyl gallium, and trimethyl gallium accounted for another 17 per cent.13
The following subsections examine how consumption, substitutability and prices were affected in the US as a result of China’s restrictions on the export of gallium.
3.1 Consumption
The data on US imports of gallium suggest that China managed to squeeze US imports after the licensing requirements took effect in August 2023.
In 2023, the US imports of gallium metal and GaAs almost halved compared to the previous year, falling to US$ 3 million and US$ 110 million, respectively.14 While the gallium metal imports recorded a decline of 40 per cent year on year, the corresponding decline for GaAs imports stood at 50 per cent.
However, in 2024, the US imports recorded a marginal increase.15 The gallium metal imports rose to US$ 4 million - a 24 per cent increase - while GaAs imports jumped to US$ 140 million - a 33 per cent increase.
The drop in 2023 was expected, as supply remained disrupted throughout most of the second half of the year due to China’s sudden introduction of licensing requirements. As Chinese suppliers acquired the necessary licenses by the end of 2023, US imports of gallium metal in 2024 roughly rebounded to pre-licensing levels. However, it is important to note that the corresponding import figures for GaAs failed to rebound to pre-licensing levels.
Figure 1: Gallium Imports by Value

In December 2024, China placed a blanket ban on the export of gallium (and germanium) to the US before suspending it in November 2025 for a one-year period. China’s decision was aimed at imposing an even higher cost on US gallium consumption than its prior decision to subject US imports to licensing requirements.
Defying expectations, US imports remained somewhat resilient. In 2025, US imports of GaAs wafers dropped marginally to US$ 120 million, a ~15 per cent year-on-year decline.16 The decline wasn’t as significant despite China’s blanket ban. Interestingly, the US imports of gallium metal increased nearly fourfold, to US$ 15 million.
Overall, two diverging trends become evident. First, US imports of gallium metal not only remained largely stable in 2023 and 2024, but it also witnessed a near 400 per cent increase in 2025. Second, US imports of GaAs halved in 2023 after the licensing requirement came into effect, and hovered around that mark in 2024 and 2025, despite the blanket ban taking effect in December 2024.
Figure 2: Gallium Imports by Volume
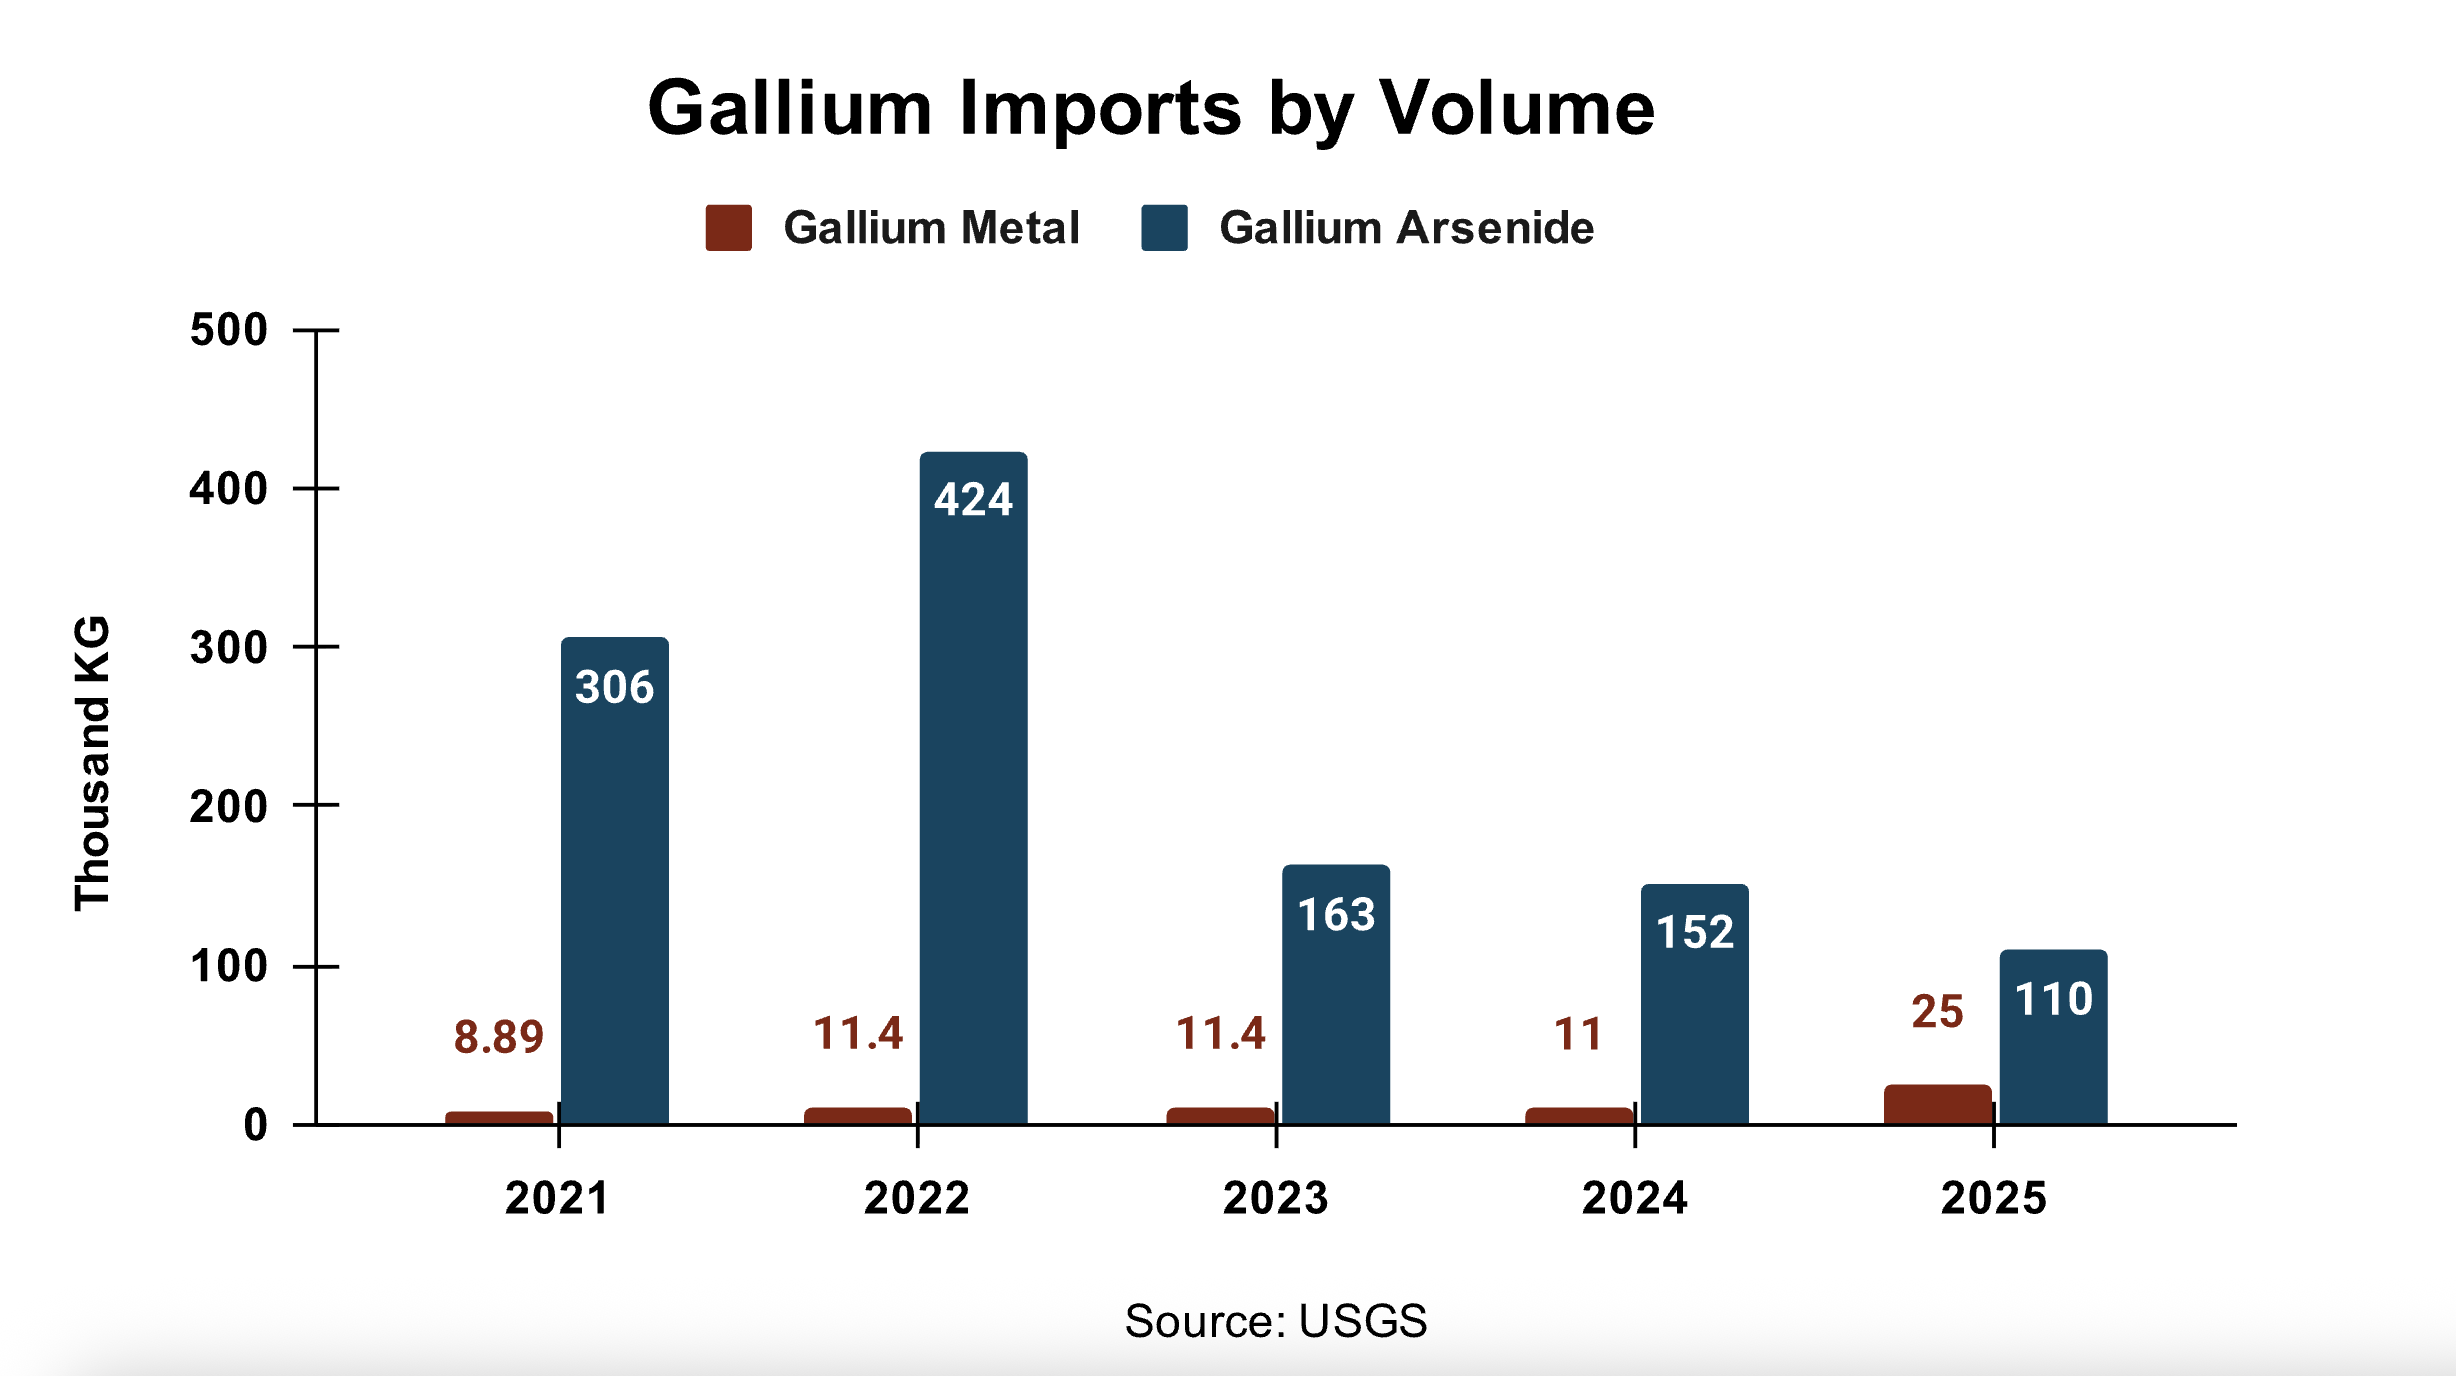
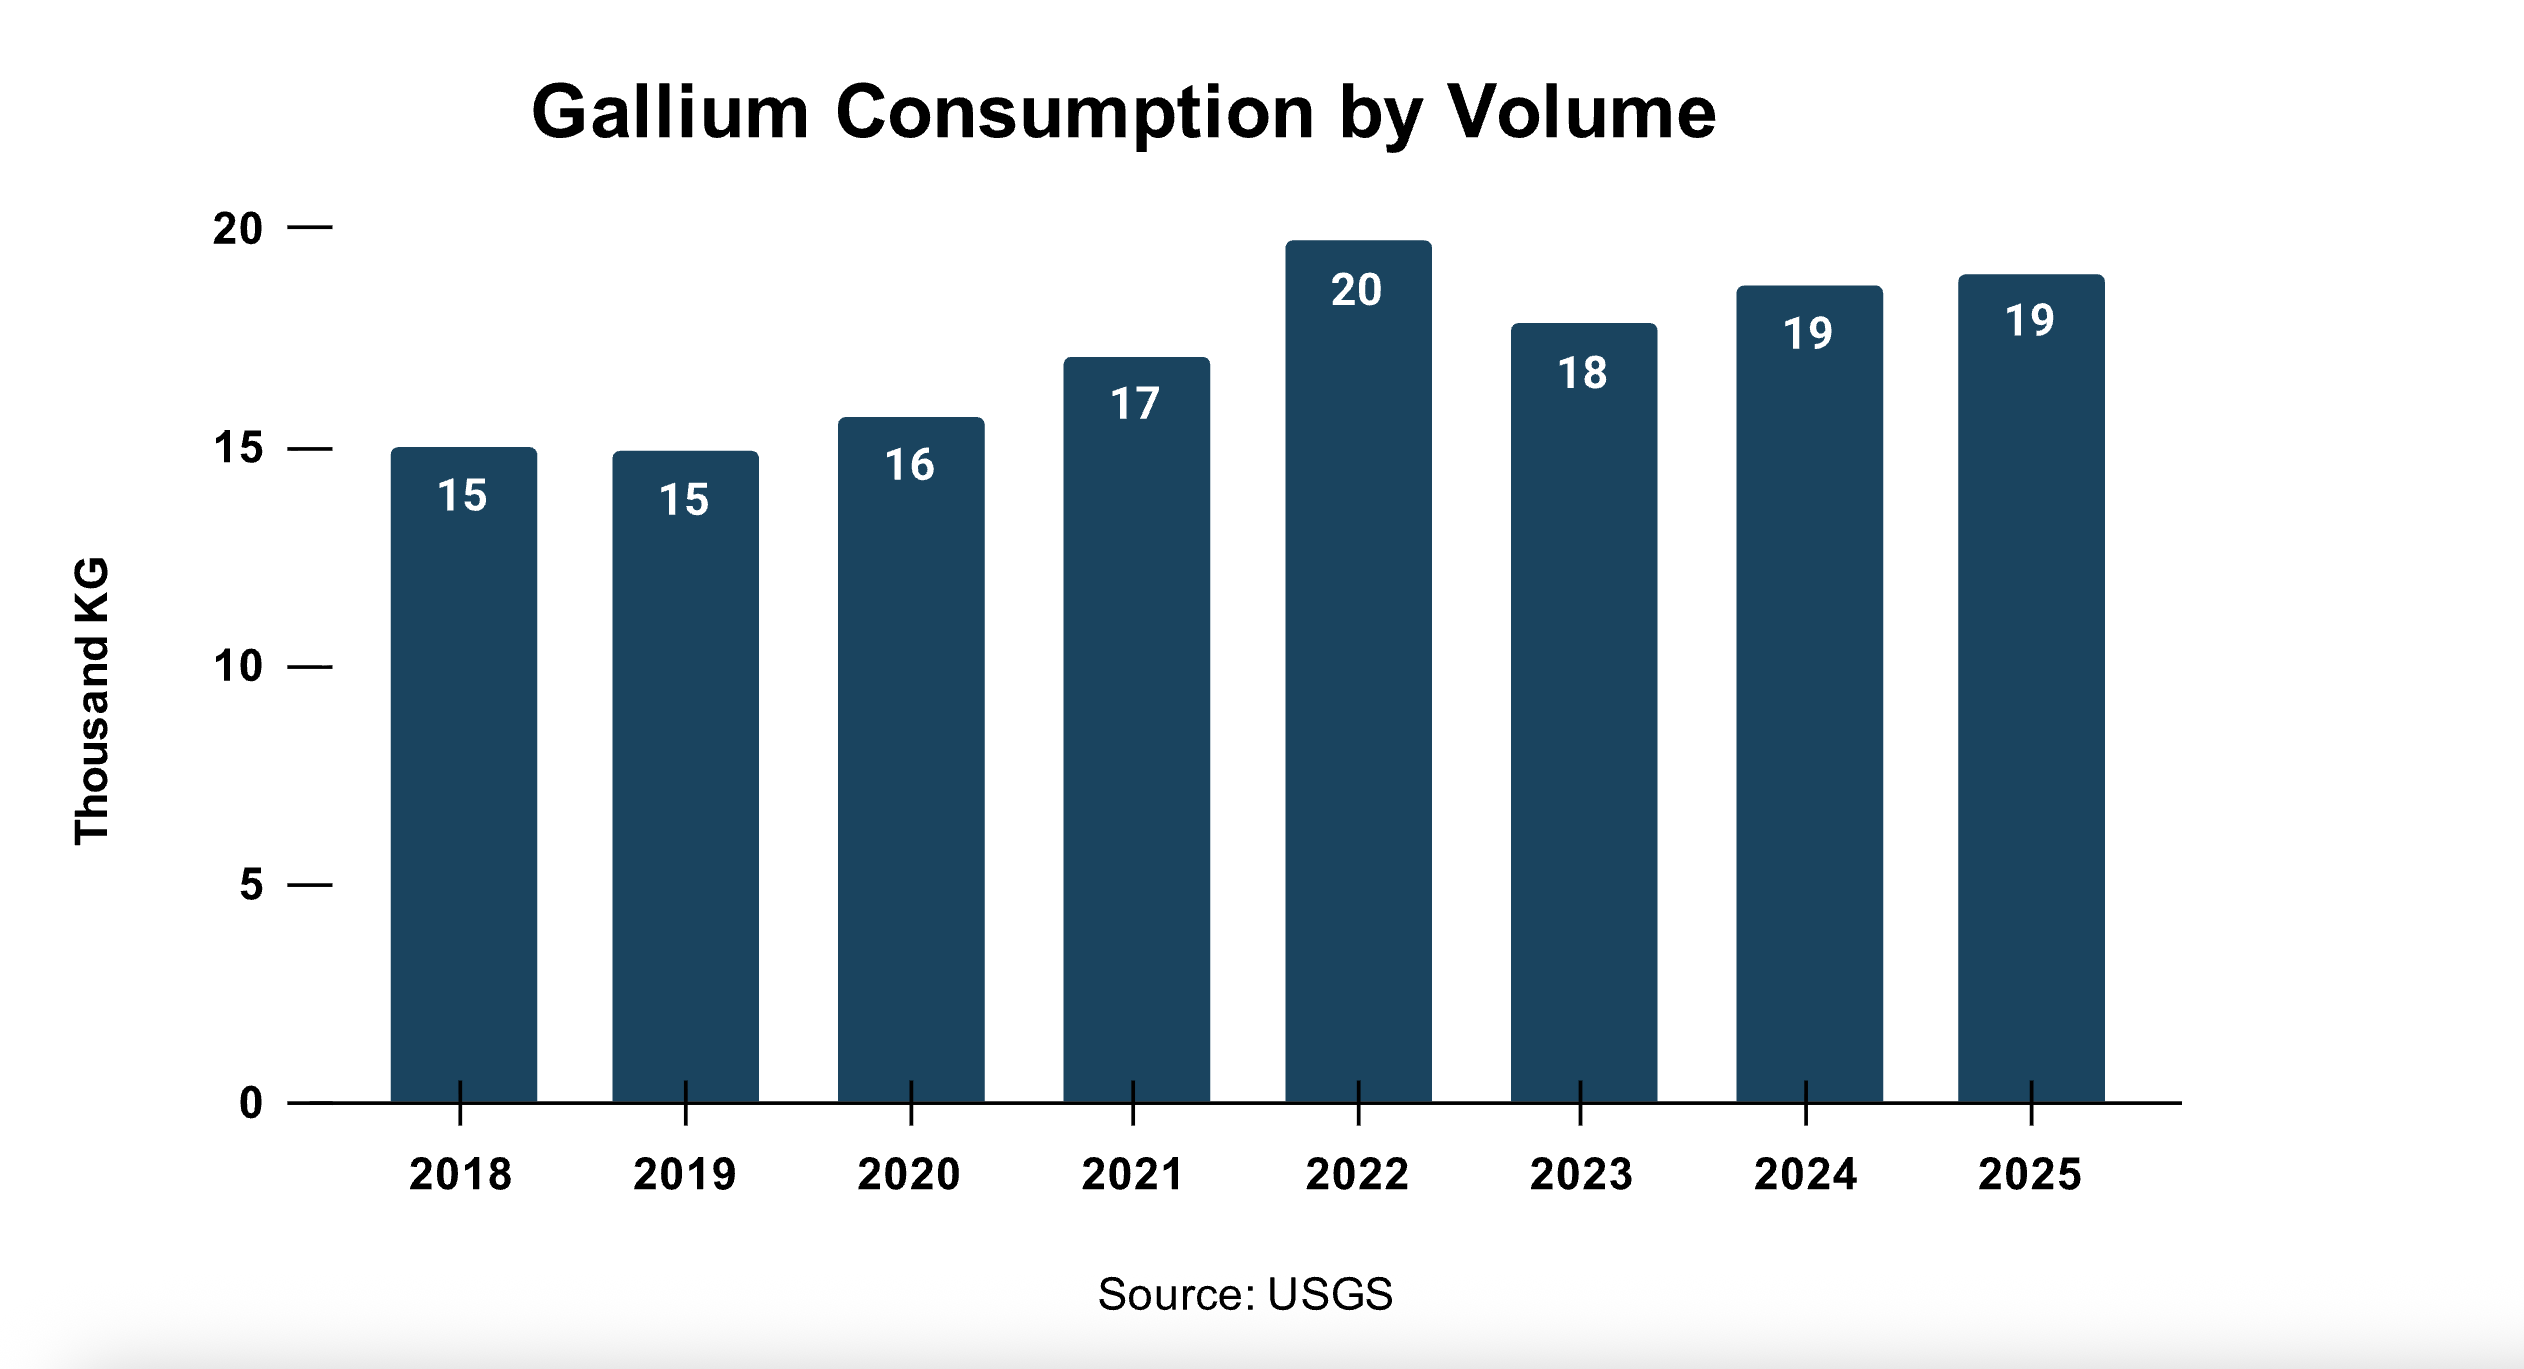
Figure 3: Gallium Consumption by Volume
In volume terms, the decline in imports of gallium arsenide was even sharper. From a 424,000 kg in 2022, imports fell to 163,000 kg in 2023, and then to 152,000 kg in 2024. In 2025, it further declined to 110,000 kg, suggesting a massive hit. On the other hand, imports of gallium metal, by volume, remained largely stable in 2023 and 2024, before registering an over 200 per cent increase in 2025.
However, during this turbulent period (July 2023-Nov 2025), the US’ reported domestic consumption of gallium (inclusive of gallium metal and gallium content in wafers) did not reflect any disruption. Not only did consumption remain stable, but it also saw a marginal year-on-year increase over the years, except in 2023.
Therefore, given that the US’ consumption of gallium remained unaffected despite China’s recourse to export controls, China can hardly claim any success on this metric.
3.2 Substitution
The US appears to have achieved substantial diversification away from China. In fact, that trend was already underway even before China unveiled the July 2023 restrictions.
While the US entirely depends on imports to service its domestic gallium consumption, its consumption mix, coupled with China’s lack of comparable dominance in processing low-grade gallium into high-purity gallium or wafers, limit its direct dependence on China.
China’s current share in US imports of gallium metal has gradually fallen to less than 20 per cent from over 50 per cent in 2019.17
Figure 4: Gallium Metal Imports by Country
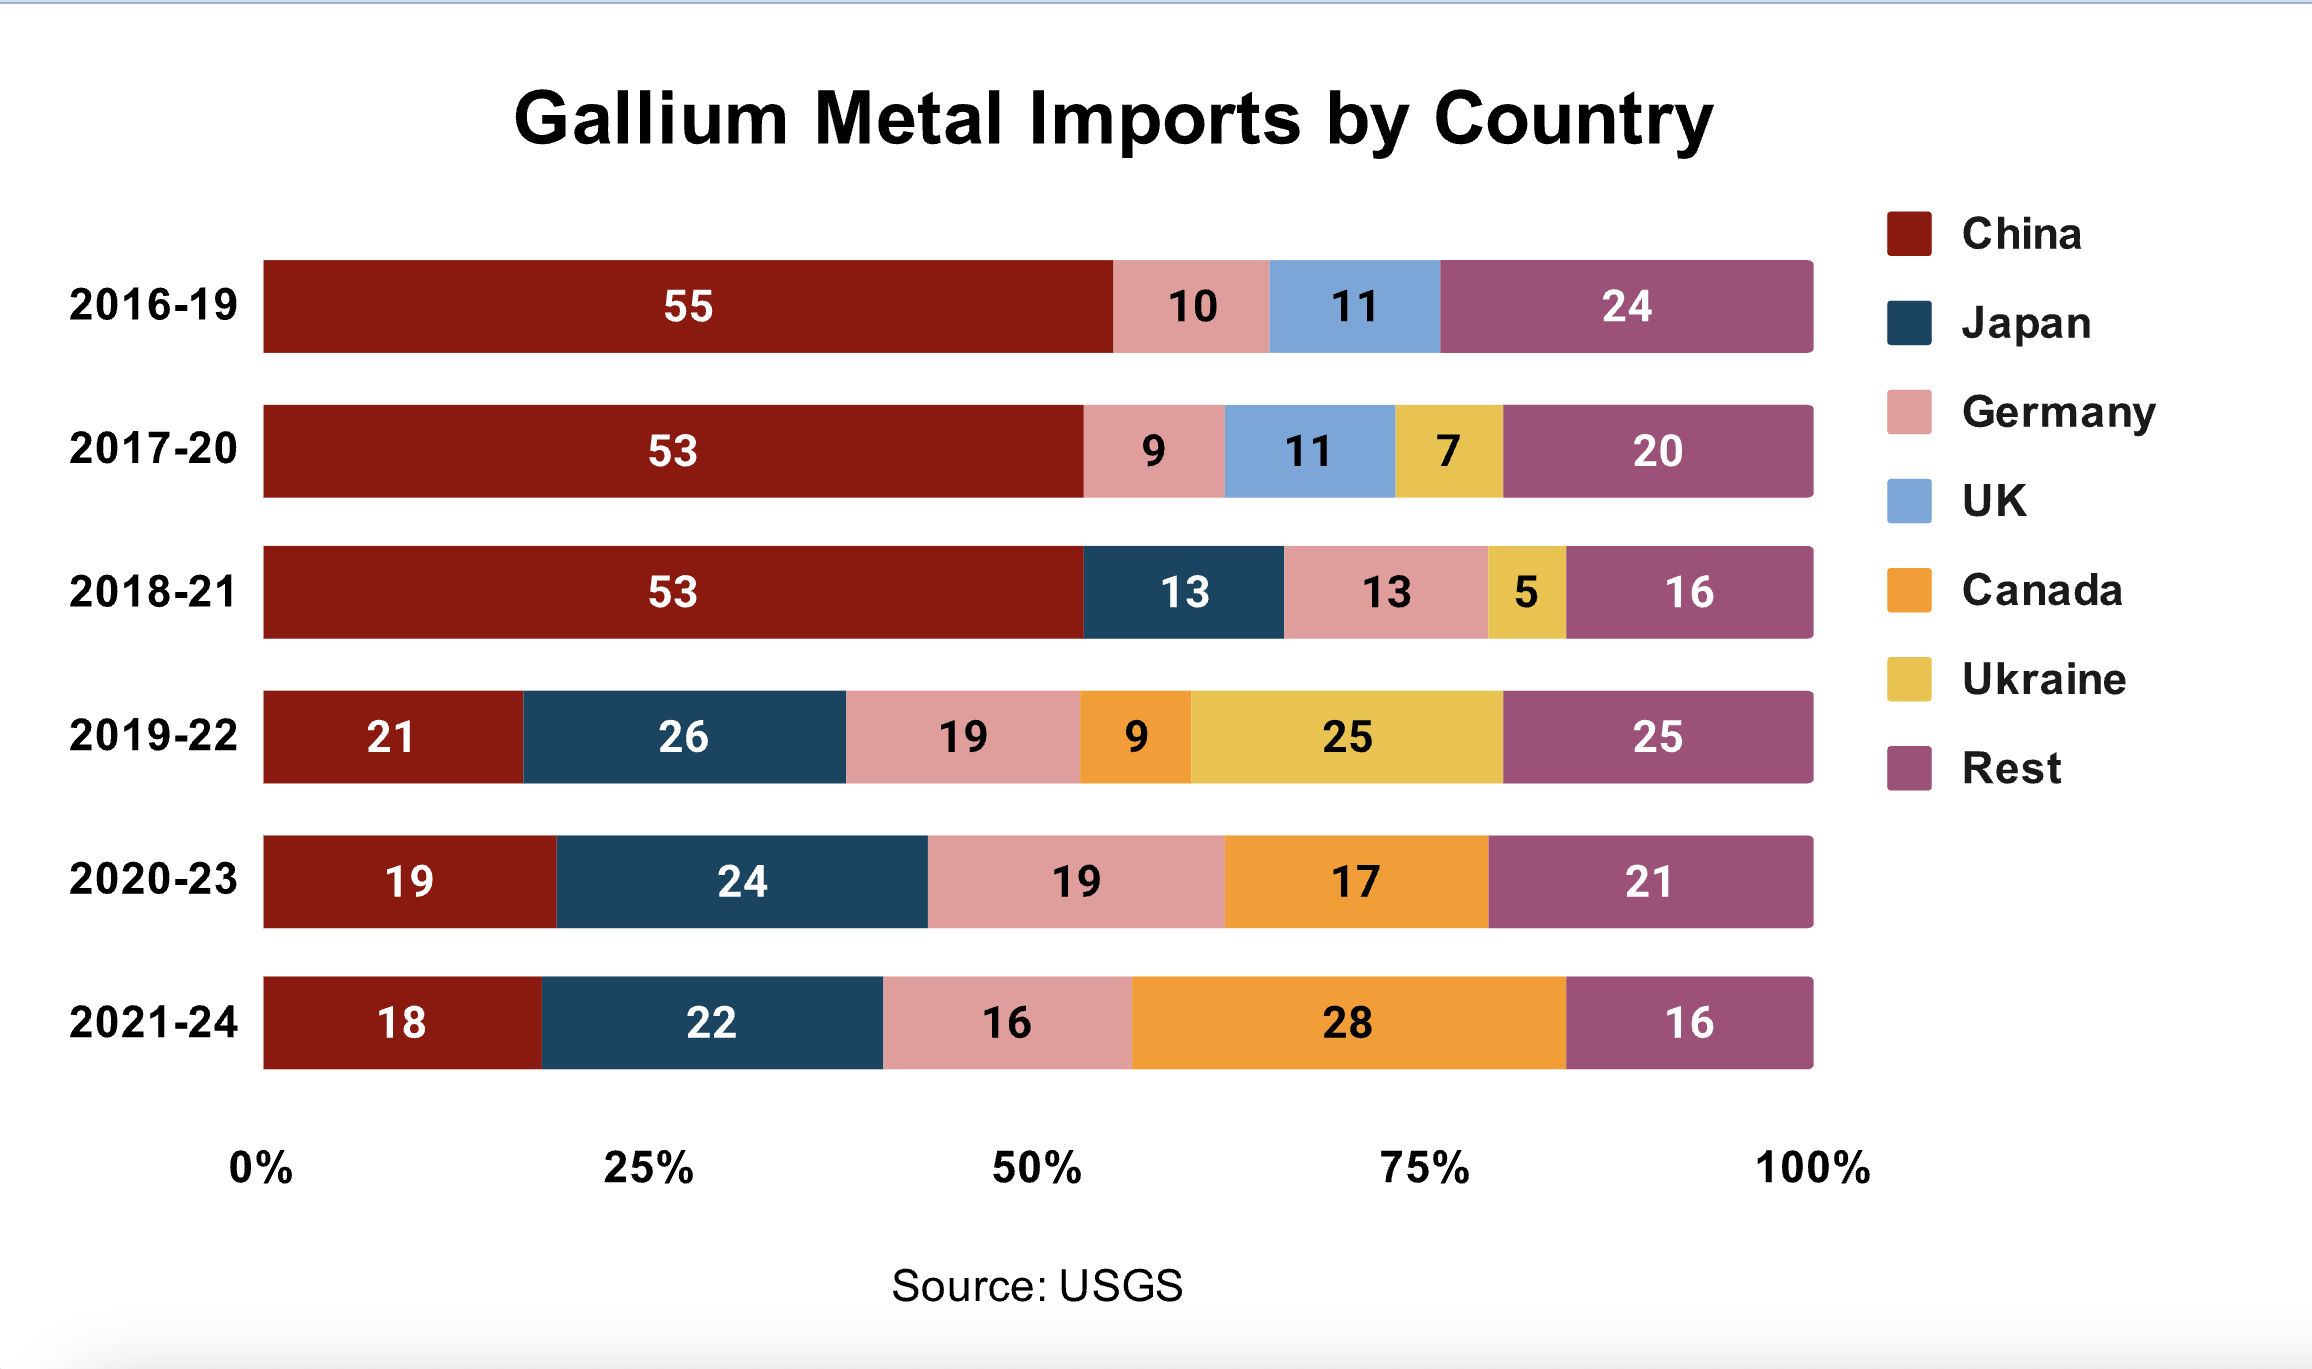
China accounted for 55 per cent of US imports of gallium metal between 2016 and 2019. Its share remained about the same until 2021. However, during the period from 2019 to 2022, it sharply dropped to just 21 per cent, suggesting a drastic fall in imports from China in 2022. Between 2021 and 2024, the US dependence on China has further reduced to 18 per cent. Canada, Japan, and Germany have emerged as the US’ primary suppliers since 2022.
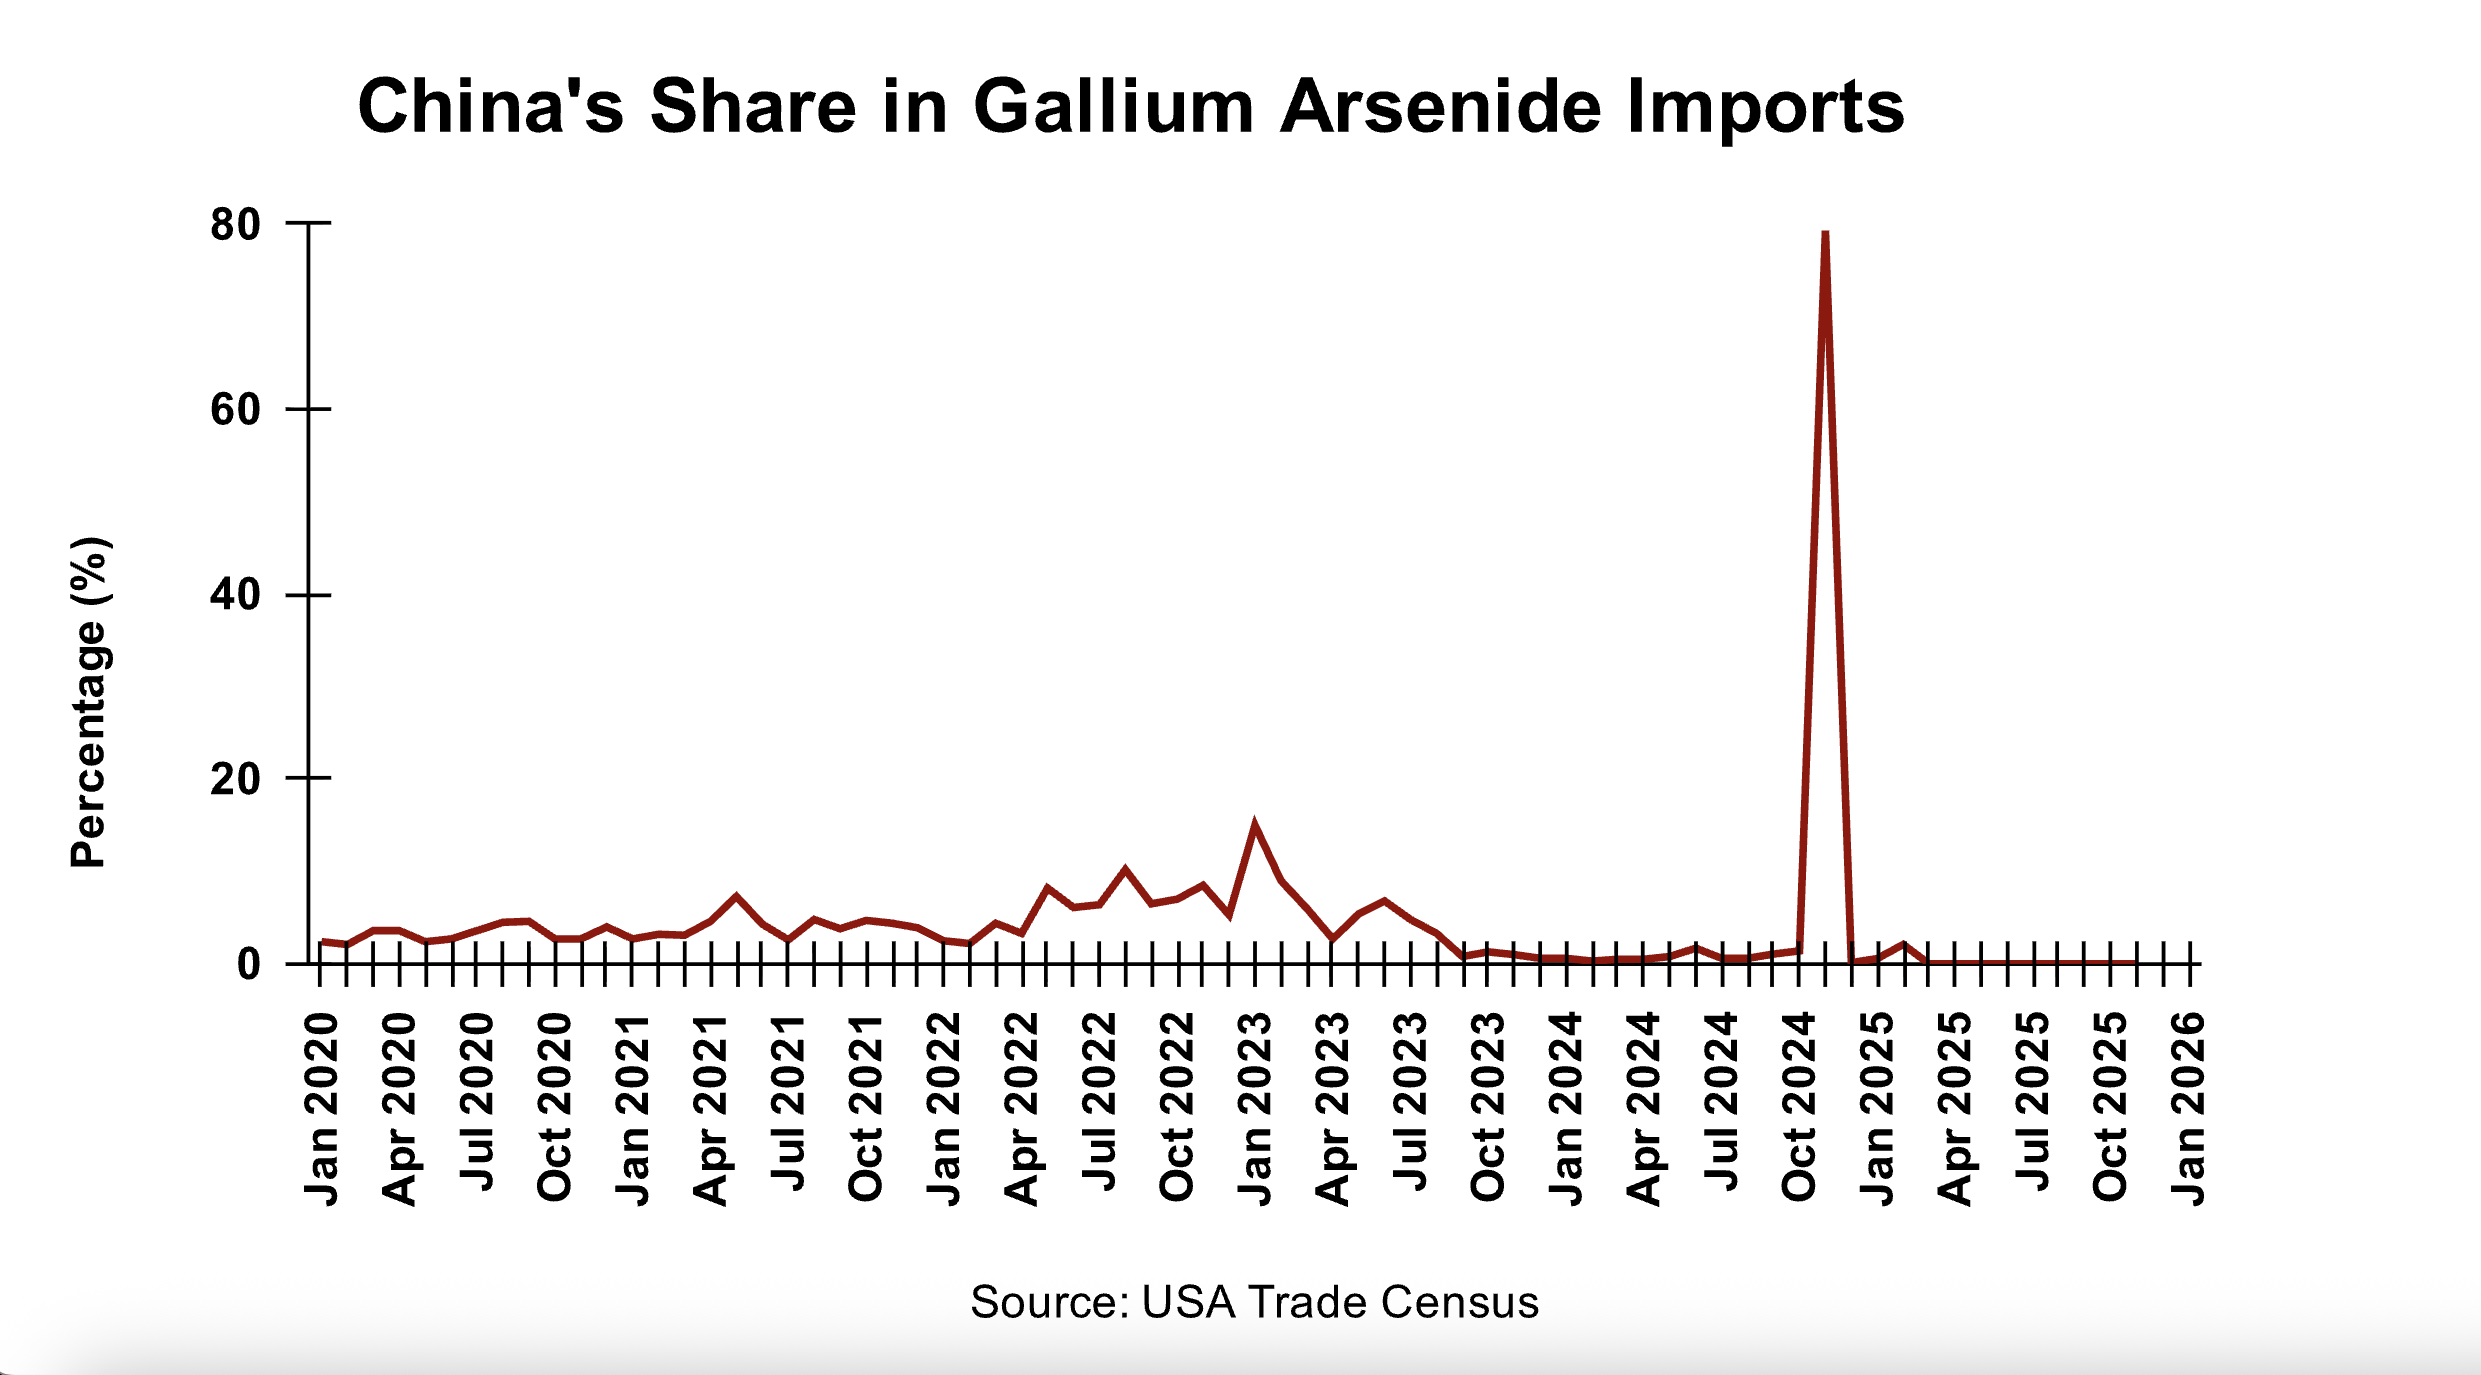
China’s share in the US’ imports of GaAs wafers, which in turn make up for an overwhelming majority of its total gallium imports, is even lower. For instance, from January 2021 to July 2023, when the licensing requirements were introduced, China’s share in US imports of GaAs averaged a mere 4.8 per cent. Between July 2023 and October 2024, the share dropped below 1 per cent.18
Interestingly, in November 2024, just a month ahead of China’s announcement of a blanket ban on export of gallium to the US, its share soared to over 79 per cent, before dropping to its earlier levels.19 Eventually, US imports of GaAs from China stopped in April 2025 and have remained so, since then.
Figure 5: China’s Share in Gallium Arsenide Imports
The data (refer to Figure 4) shows that the US has substantially diversified its gallium imports away from China. But what is even more notable is that the US managed to sustain its domestic consumption of gallium while diversifying away from China. The latest numbers, hence, suggest that the US consumption of gallium remained unaffected by China’s export controls, be it licensing or ban.
The US managed to keep its gallium consumption afloat, despite China’s export controls and subdued GaAs imports, through a combination of two approaches. First, scaling imports of gallium metal almost by 400 per cent. And second, expanding domestic production of GaAs and GaN wafers to offset import shortfalls.20
In addition, the US has also found alternatives for GaAs in certain applications, except in the defence and military domain. According to the USGS, liquid crystals made from organic compounds are substituting LEDs in visual displays.21 Further, silicon-based complementary metal-oxide semiconductor power amplifiers are competing with GaAs power amplifiers in 3G cellular handsets.22 Indium phosphide components have also emerged as substitutes for GaAs-based infrared laser diodes in some specific-wavelength applications.23 Helium-neon lasers are competing with GaAs in visible laser diode applications. GaAs application in solar cells is being substituted with silicon.24 In heterojunction bipolar transistors, GaAs is being replaced in some applications by silicon germanium. However, in defence-related applications, GaAs- and GaN-based ICs are not easily substitutable owing to their unique properties.
Additionally, there is one facility in New York that recovers high-purity gallium by refining imported low-purity gallium and reprocessing the new scrap generated in the manufacturing of GaAs wafers.25 Mettalium, an Australian company, is also setting up a recycling plant in the US to obtain high-purity gallium from industrial electronic scrap.26
In September, the U.S. Department of Energy announced US$ 6 million in funding for domestic research and development projects to help establish a domestic supply chain for gallium. This initiative was expected to support technologies to recover gallium from alumina refining or primary zinc smelting, with the goal of restarting domestic primary gallium recovery for the first time in almost 40 years. In November, the U.S. Department of War, under the ‘Defense Production Act,’ granted a US$ 29.9 million award to a U.S. company to develop a demonstration facility in Louisiana that will recover gallium and scandium from industrial waste.27
3.3 Price Volatility
Gallium prices can vary based on grade (high- or low-purity), distribution (wholesale or retail), and market (international, or within China). Data compiled from various sources indicates that average prices for gallium substantially increased after China’s imposition of export controls in July 2023.
Figure 6: High-Purity Gallium Prices
International retail prices for high-purity gallium witnessed the maximum appreciation. Wholesale prices in the international market for gallium closely tracked its retail prices in China. Even though China is not a global leader in processing low-purity gallium into high-purity gallium, the fact that it produces ~99 per cent of the global low-purity gallium, allows it to trigger downstream effects on high-purity gallium prices.
Figure 7: Low-Purity Gallium Prices
International retail prices for low-purity gallium, too, witnessed a steep hike. Unlike high-purity gallium, international wholesale prices for low-purity gallium traded above the wholesale and retail prices in China after July 2023. Until then, wholesale international prices and retail Chinese prices were largely in sync.
The average annual import prices for gallium reported by the USGS also indicate that they continued to rise substantially. Thus, China’s action did succeed in raising costs for the US economy.
Figure 8: Average Gallium Price Reported by US
Yet, while the average import prices increased, the US’ consumption of gallium remained largely unaffected, thereby undercutting China’s success.
4. Germanium
US dependence on China for germanium isn’t as acute. USGS data shows that the US’ net reliance on imports as a percentage of estimated consumption is over 50 per cent.28 However, its dependence on imports as a percentage of total consumption is about 86 per cent.29 The germanium import mix consists of two items, germanium and germanium dioxide. The following subsections examine how three factors—consumption, substitutability, and price—varied for the US in light of Chinese export restrictions.
4.1 Consumption
Despite the licensing restrictions coming into effect in July 2023, which impacted supplies through most of the second half of the year, the US’ annual imports of germanium by value did not reflect any impact at all. In fact, the US’ imports by value increased by over 15 per cent in 2023 and then by 11 per cent in 2024.30
Figure 9: Germanium Imports by Value
Interestingly, the spike was even greater in 2025–32 per cent in value terms–even as the second round of restrictions in December 2024 came into effect, which banned the export of germanium to the US.31
Assessing the US import of germanium by volume sheds more light on these counterintuitive trends. The imports of germanium metal shot up by 57 per cent in 2023 despite the licensing requirements disrupting the global supplies for most of the second half of the year. The imports of germanium dioxide in 2023 remained largely unchanged from 2022 in volume terms, recording a marginal decline of 6.6 per cent.32
Figure 10: Germanium Imports by Volume
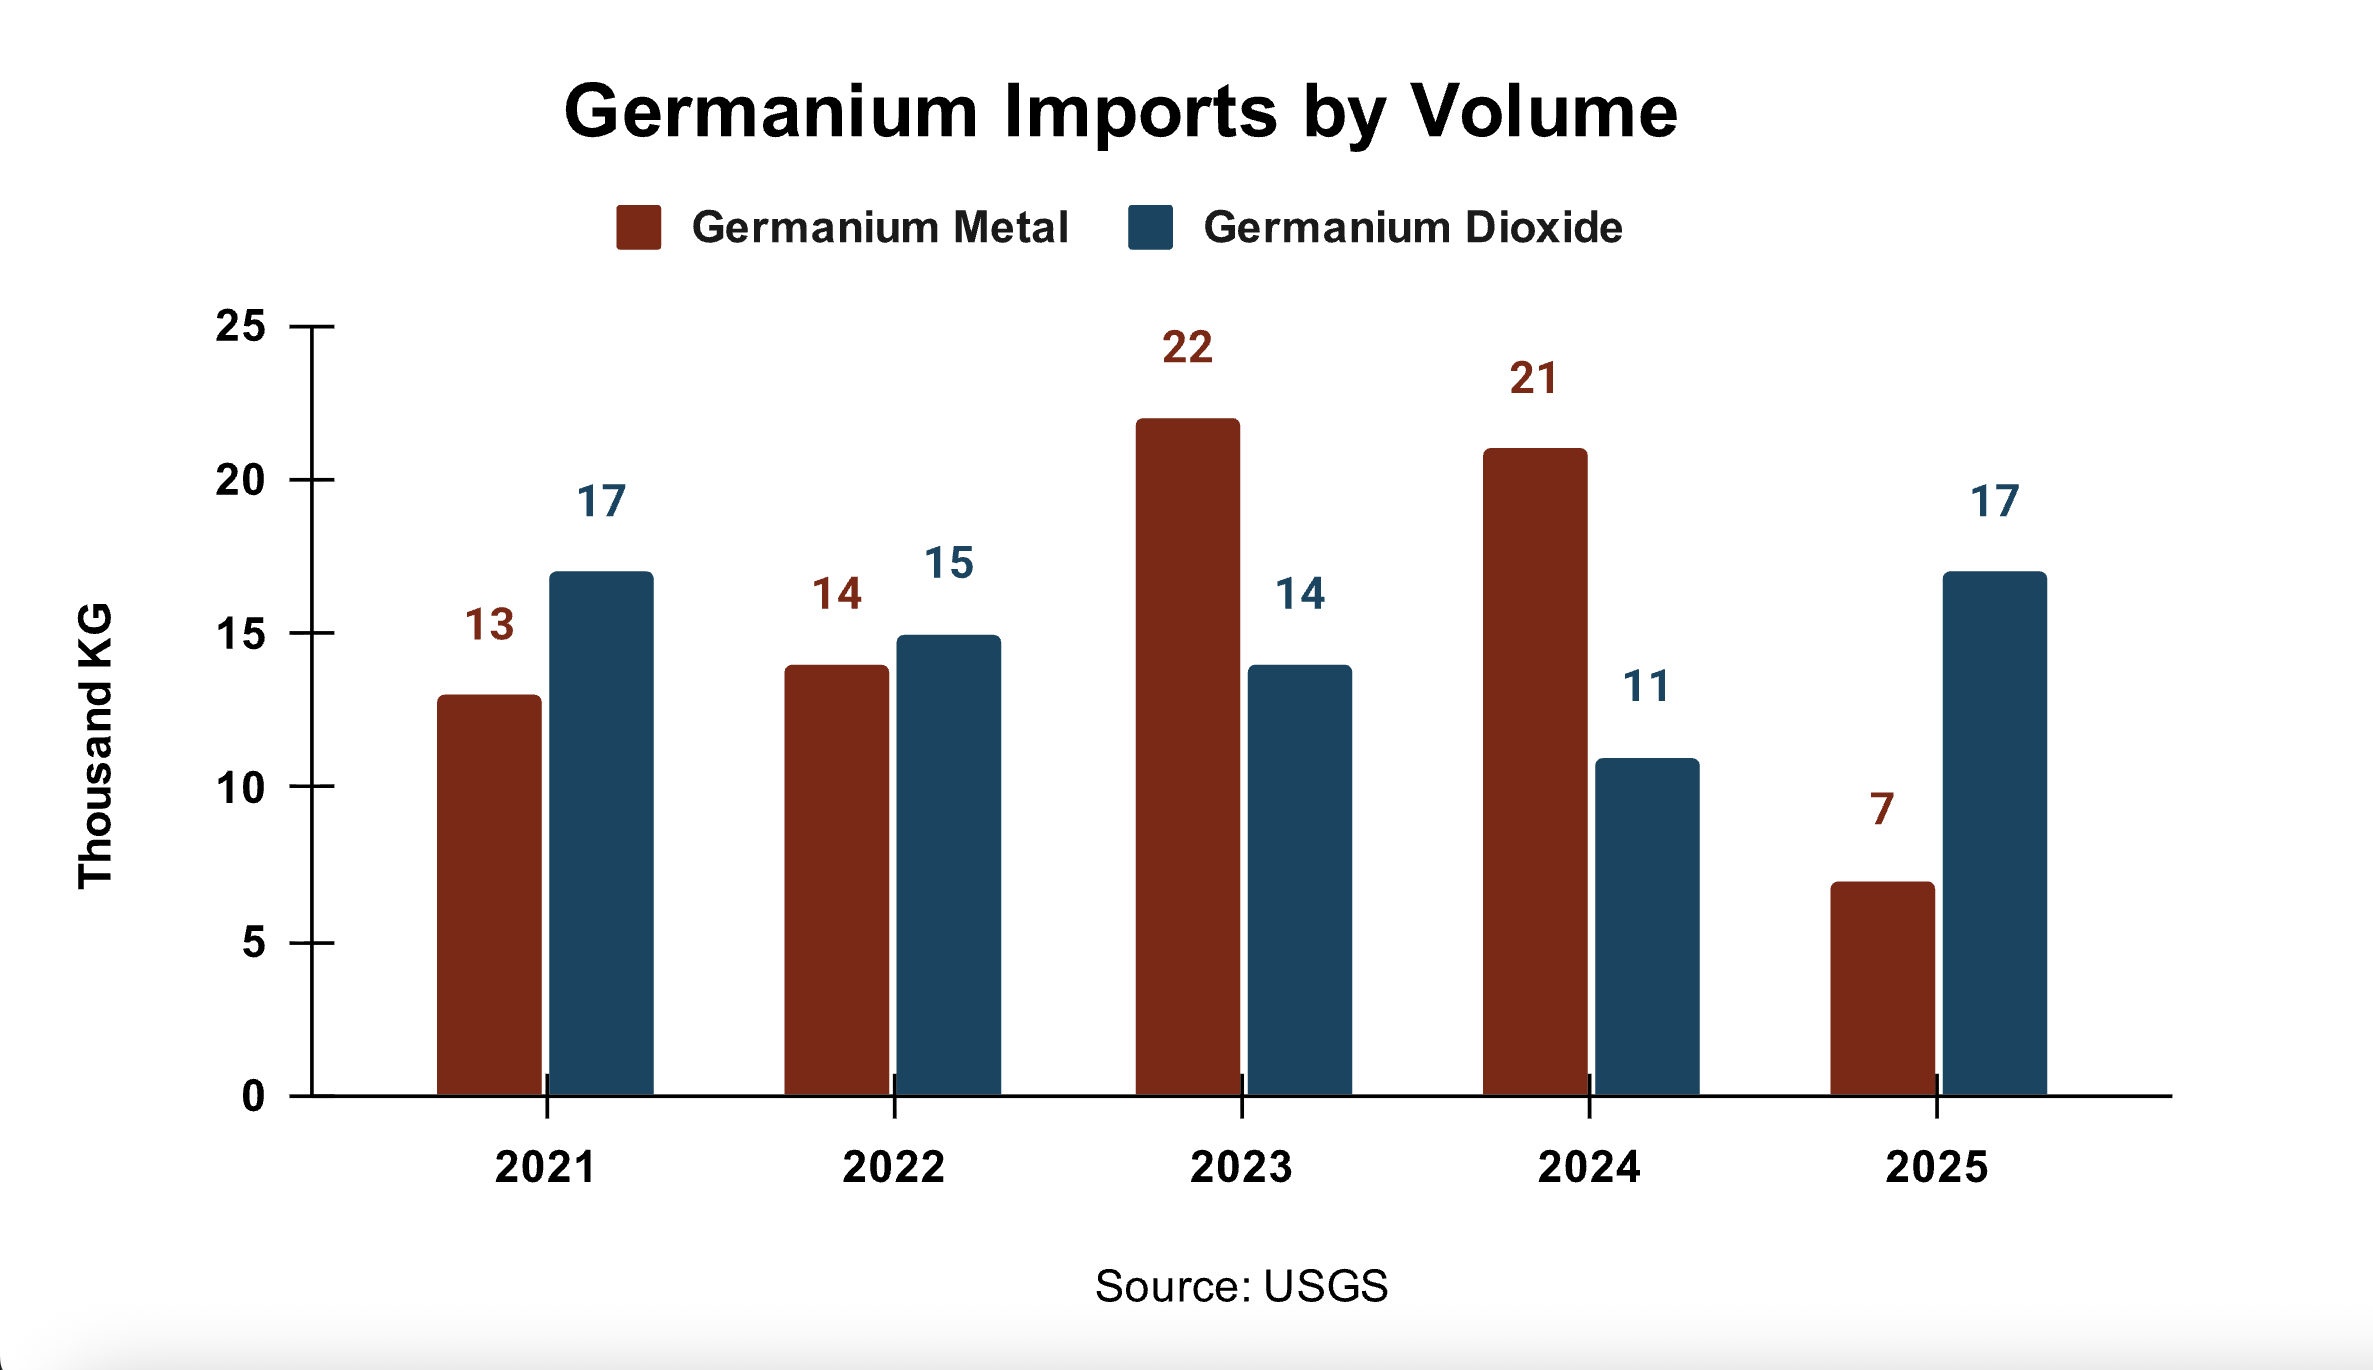
In 2024, while the licensing requirements remained in place for most of the year until December 2024, when China announced a blanket ban, the US imports of germanium metal still remained substantially high, at 21,000 kg compared to 22,000 kg in 2023.33 This was a significant jump from the average 13,500 kgs of germanium metal imported by the US in 2021 and 2022. The import of germanium dioxide, on the other hand, witnessed a year-on-year drop of 21 per cent by volume in 2024 before sharply rebounding to 17,000 kg in 2025. The import of germanium metal in 2025, however, was only a third of the volume imported in 2024.
Only if the USGS published annual domestic consumption for germanium as it does for gallium, it would have been easier to evaluate the impact of China’s export restrictions on the US. However, a lack of domestic consumption data limits the assessment.
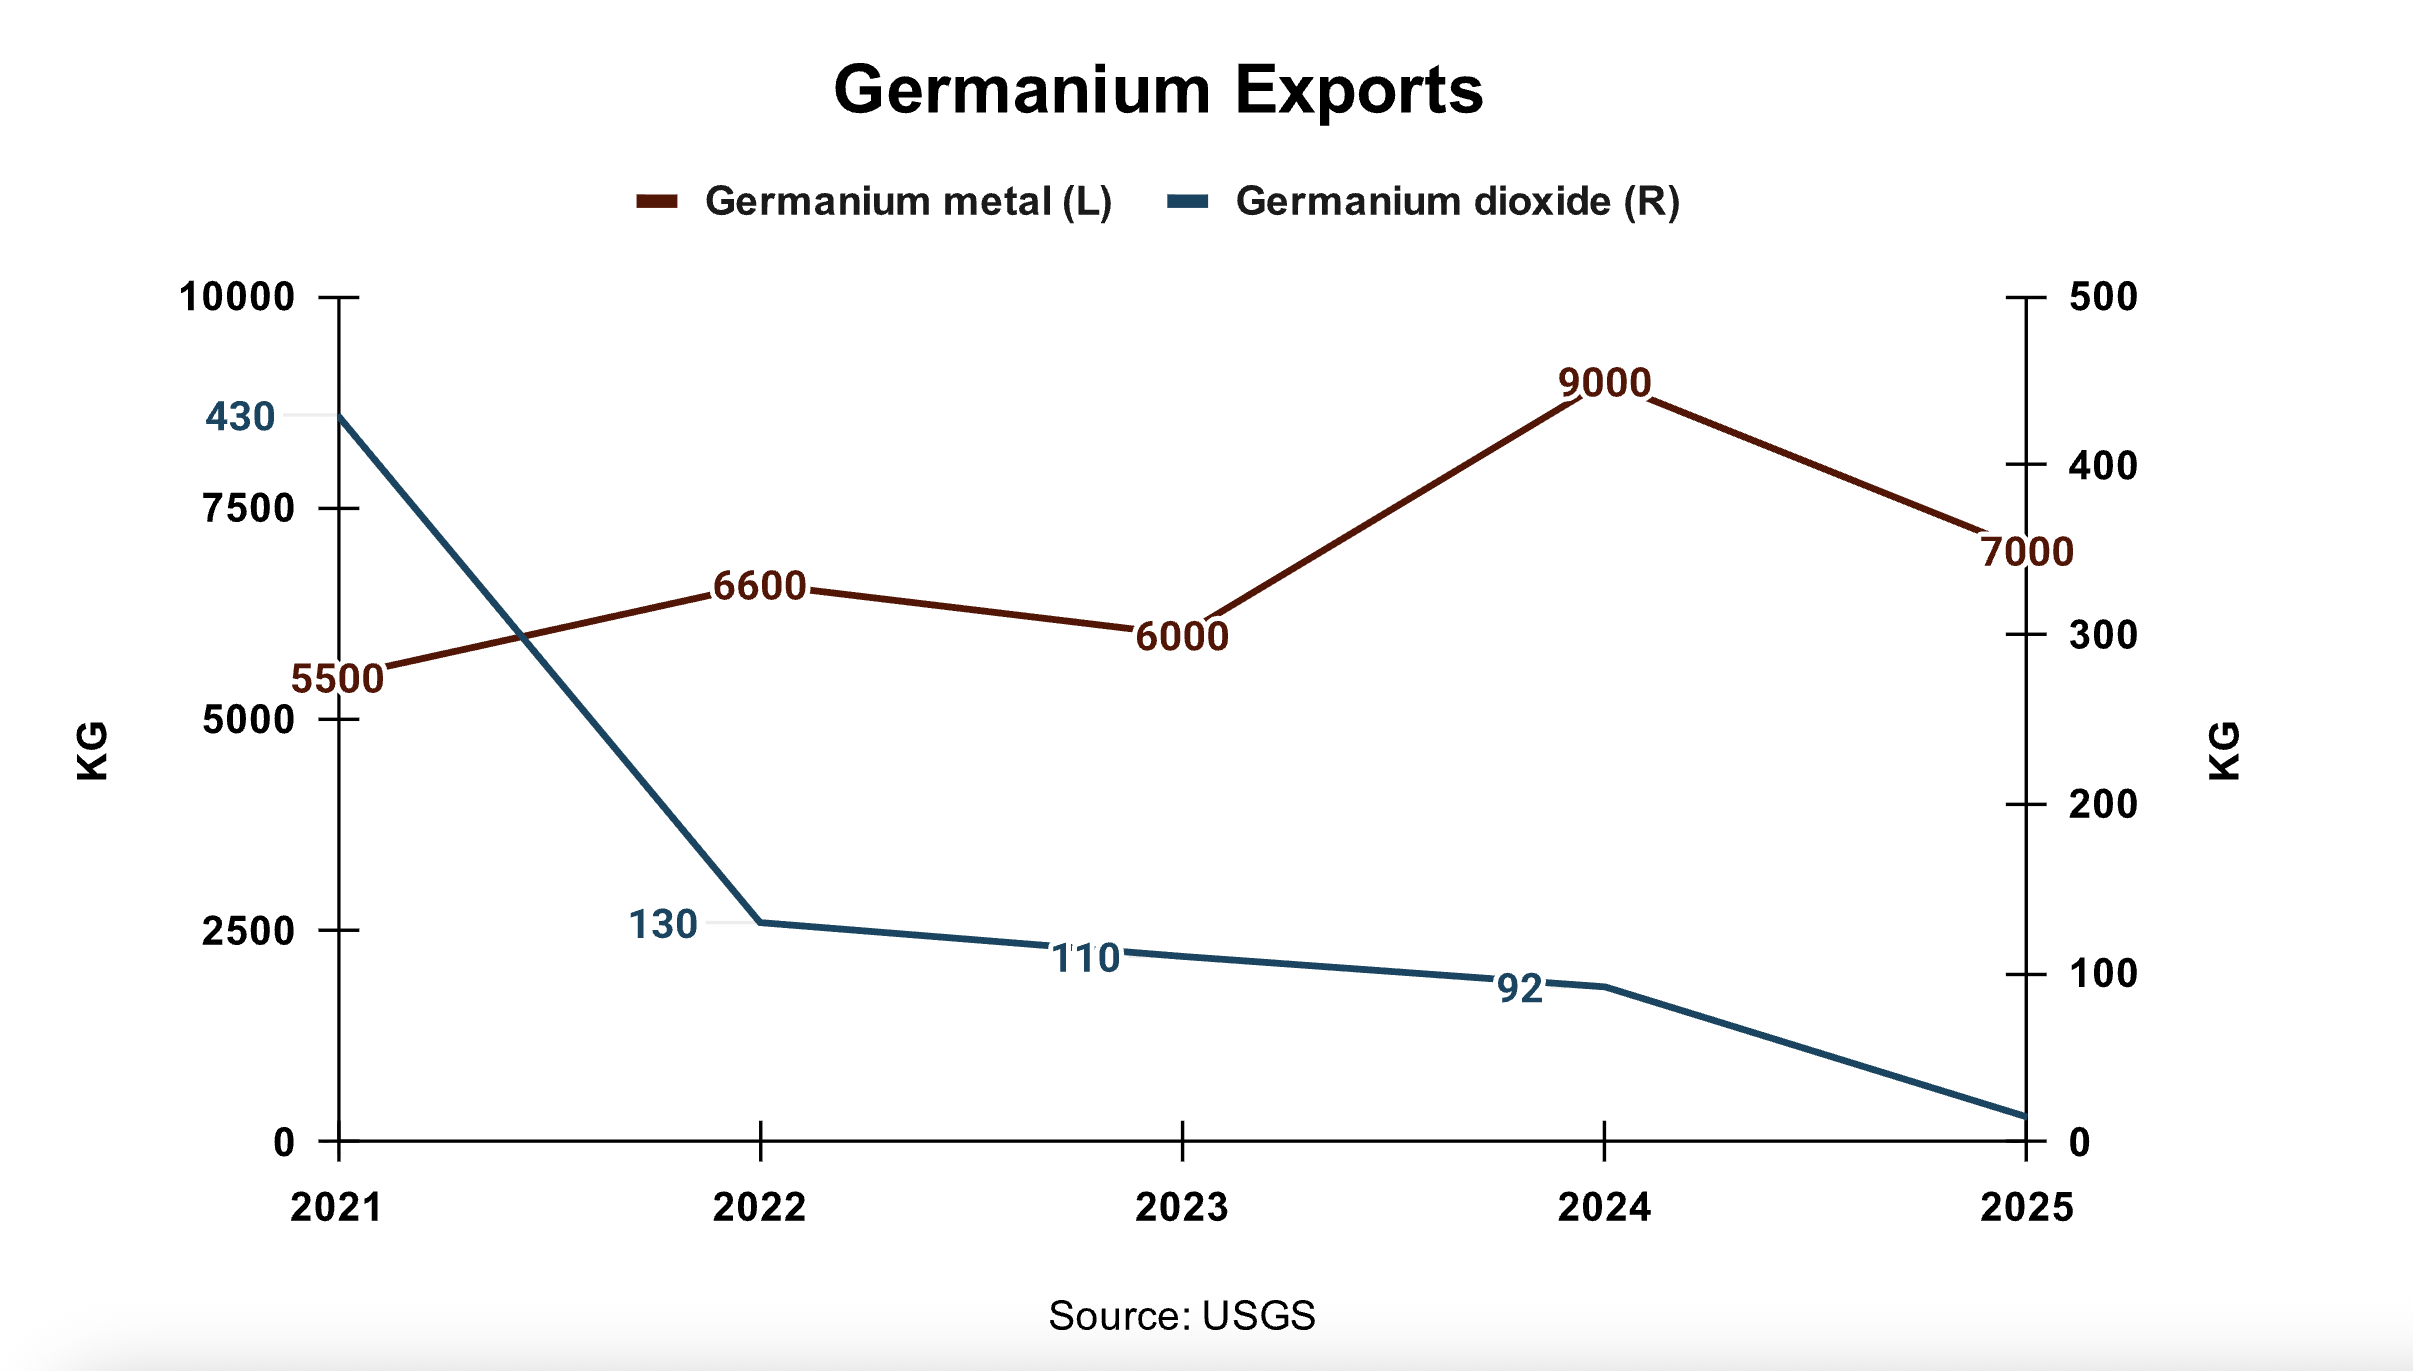
Nevertheless, there is a greater likelihood that the US consumption of germanium didn’t suffer either despite China’s export restrictions. One, germanium dioxide imports by volume in 2025 were the highest since 2021. Second, while imports of germanium metal sharply declined in 2025, it is possible that the decline was a result of stockpiling of the metal in the previous two years, evident in the fact that metal imports skyrocketed in 2023 and 2024. Third, the US maintains a national stockpile of germanium, which it must have dipped into to meet its requirement. Fourth, the US has a significant recycling capability to recover germanium from scrap.34 And finally, the US’ exports of germanium metal and dioxide indicate that a significant amount of domestic capacity was consumed locally in 2023 and 2025. The US’s exports in 2023 declined as export restrictions came into effect. But as licenses were procured by the end of 2023, allowing for imports from China, the US exports of germanium dioxide increased. However, after China announced a blanket ban in December 2024, the US’ export figures dipped sharply again.
Figure 11: Germanium Exports
Thus, it is evident from the data from the past five years that China’s export restrictions failed to adversely impact the US’ consumption of germanium. Despite Beijing’s attempts to choke the global supply, the US managed to meet its demand.
4.2 Substitution
Even though the US is not completely dependent on imports to meet its domestic needs, they are substantial by value. Figure 12 shows US’ import dependence by country relating to germanium metal. It reveals that import dependence on China remains significant, even as it may have reduced in recent years.35
Figure 12: Germanium Metal Imports by Country
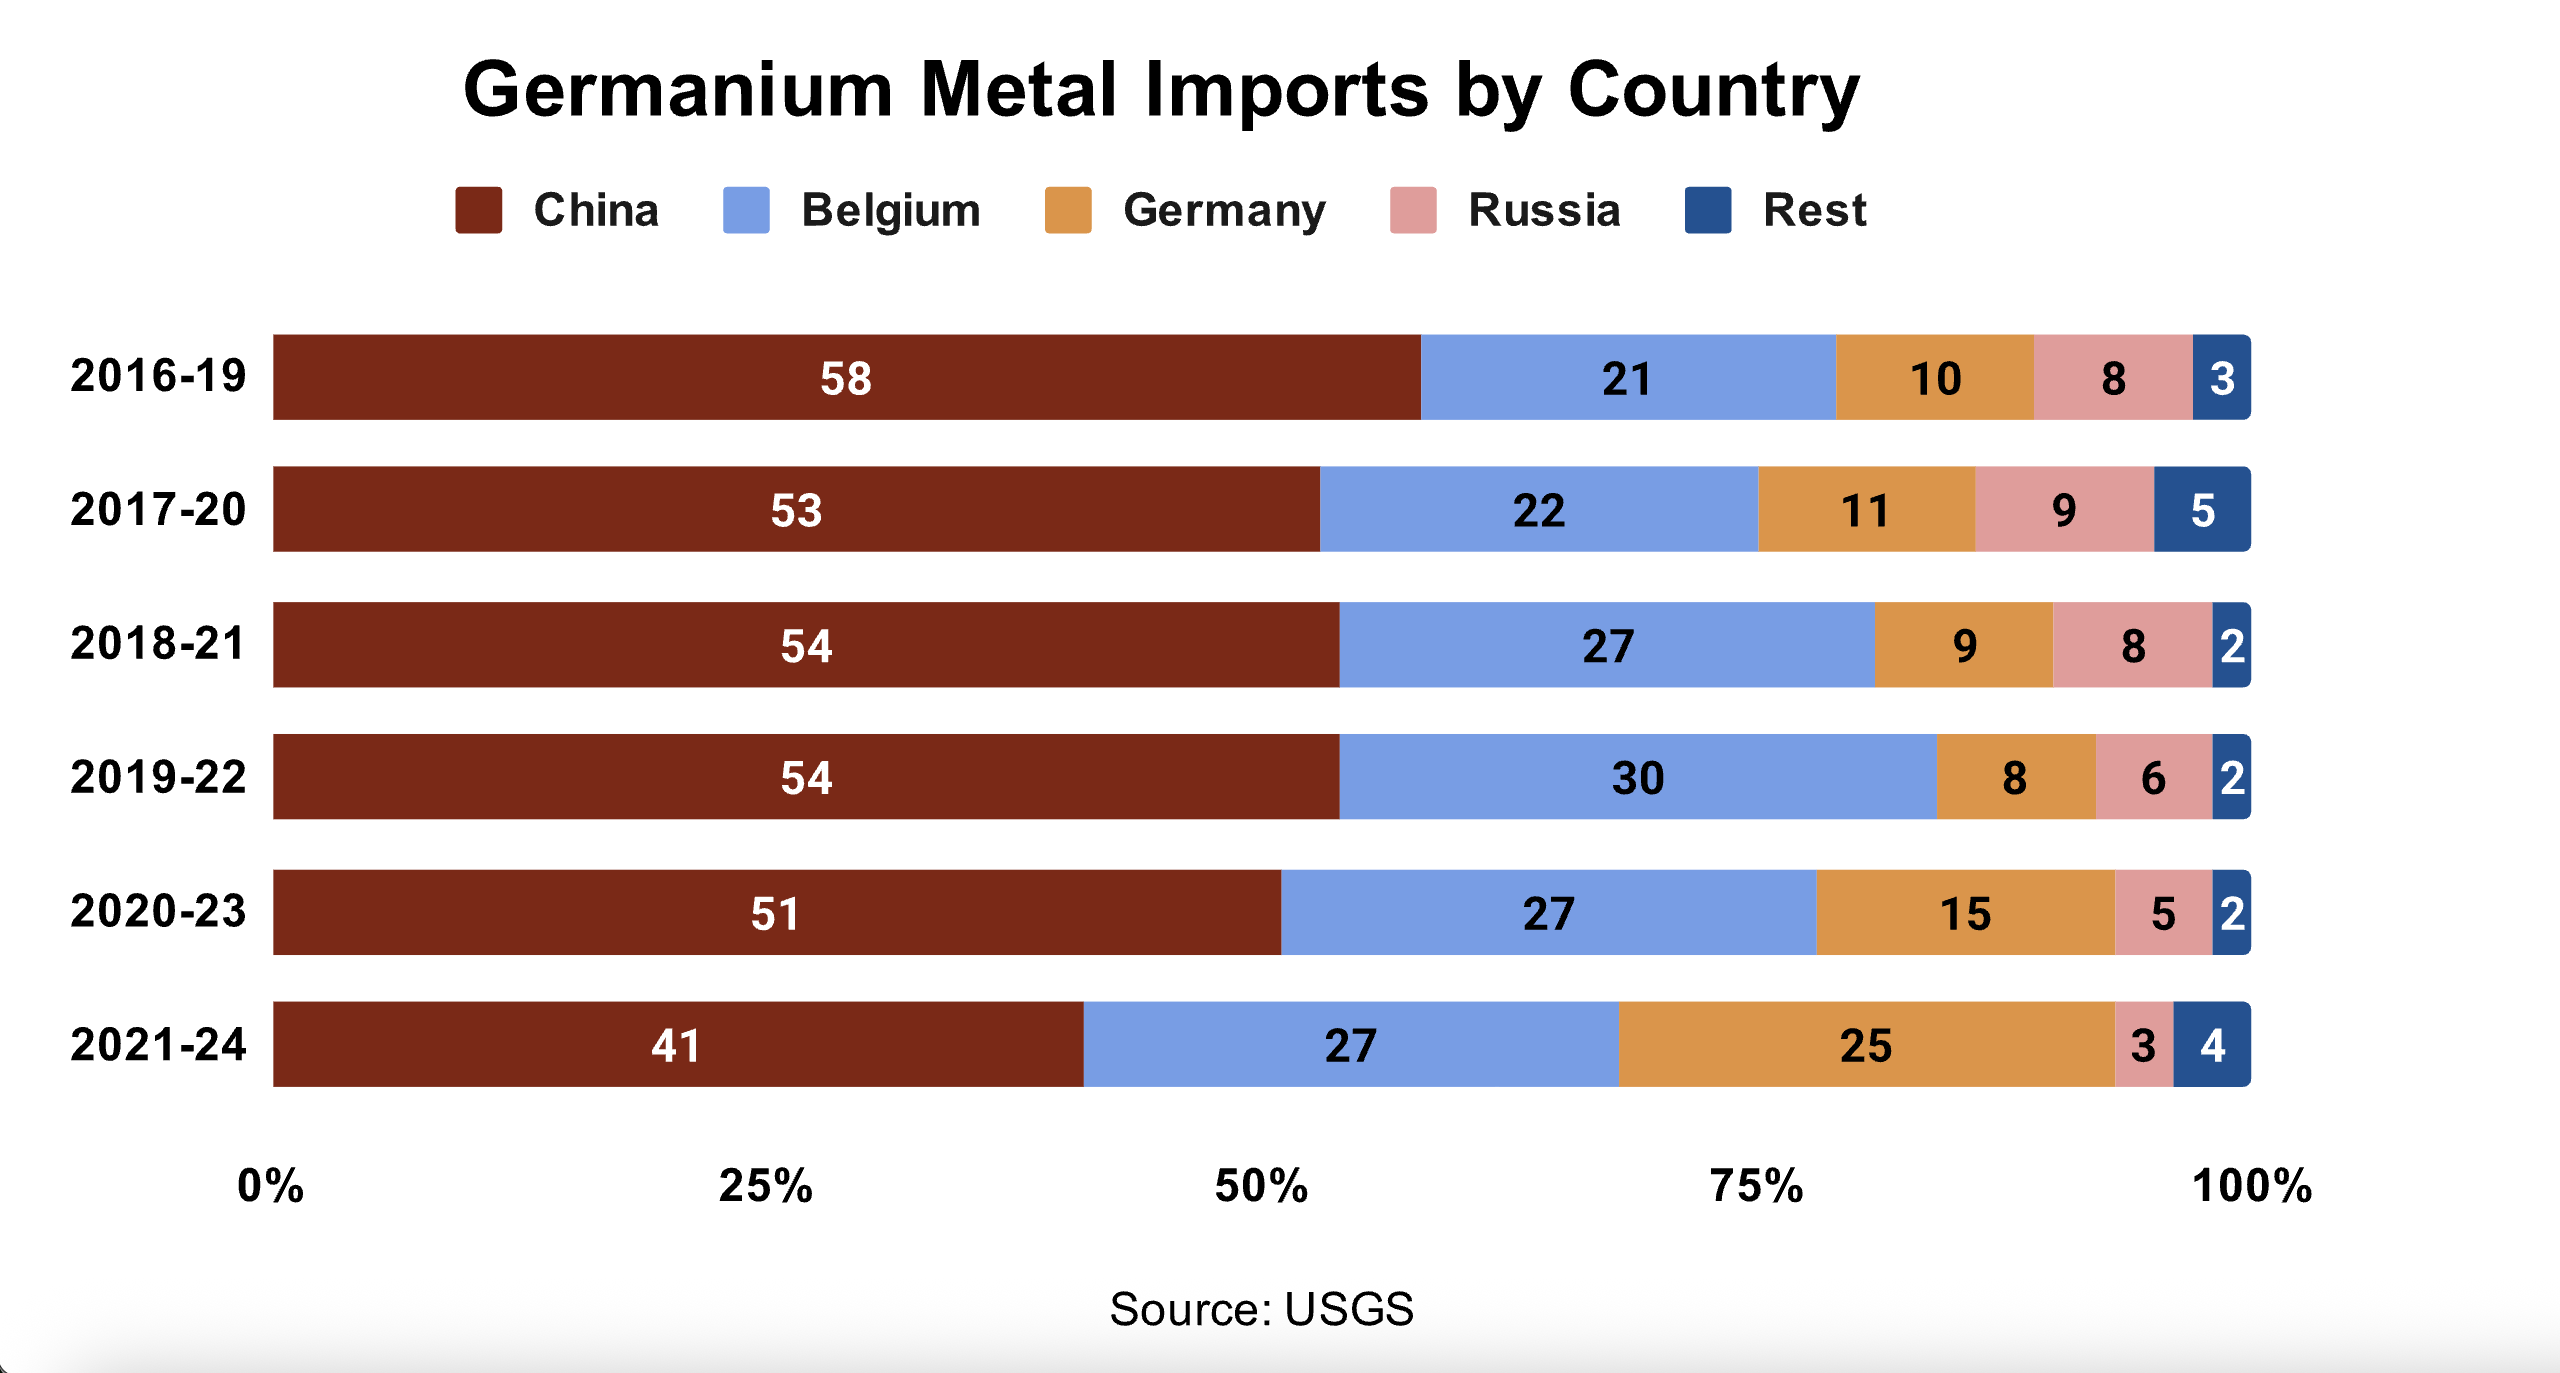
Figure 13: Germanium Dioxide Imports by Country
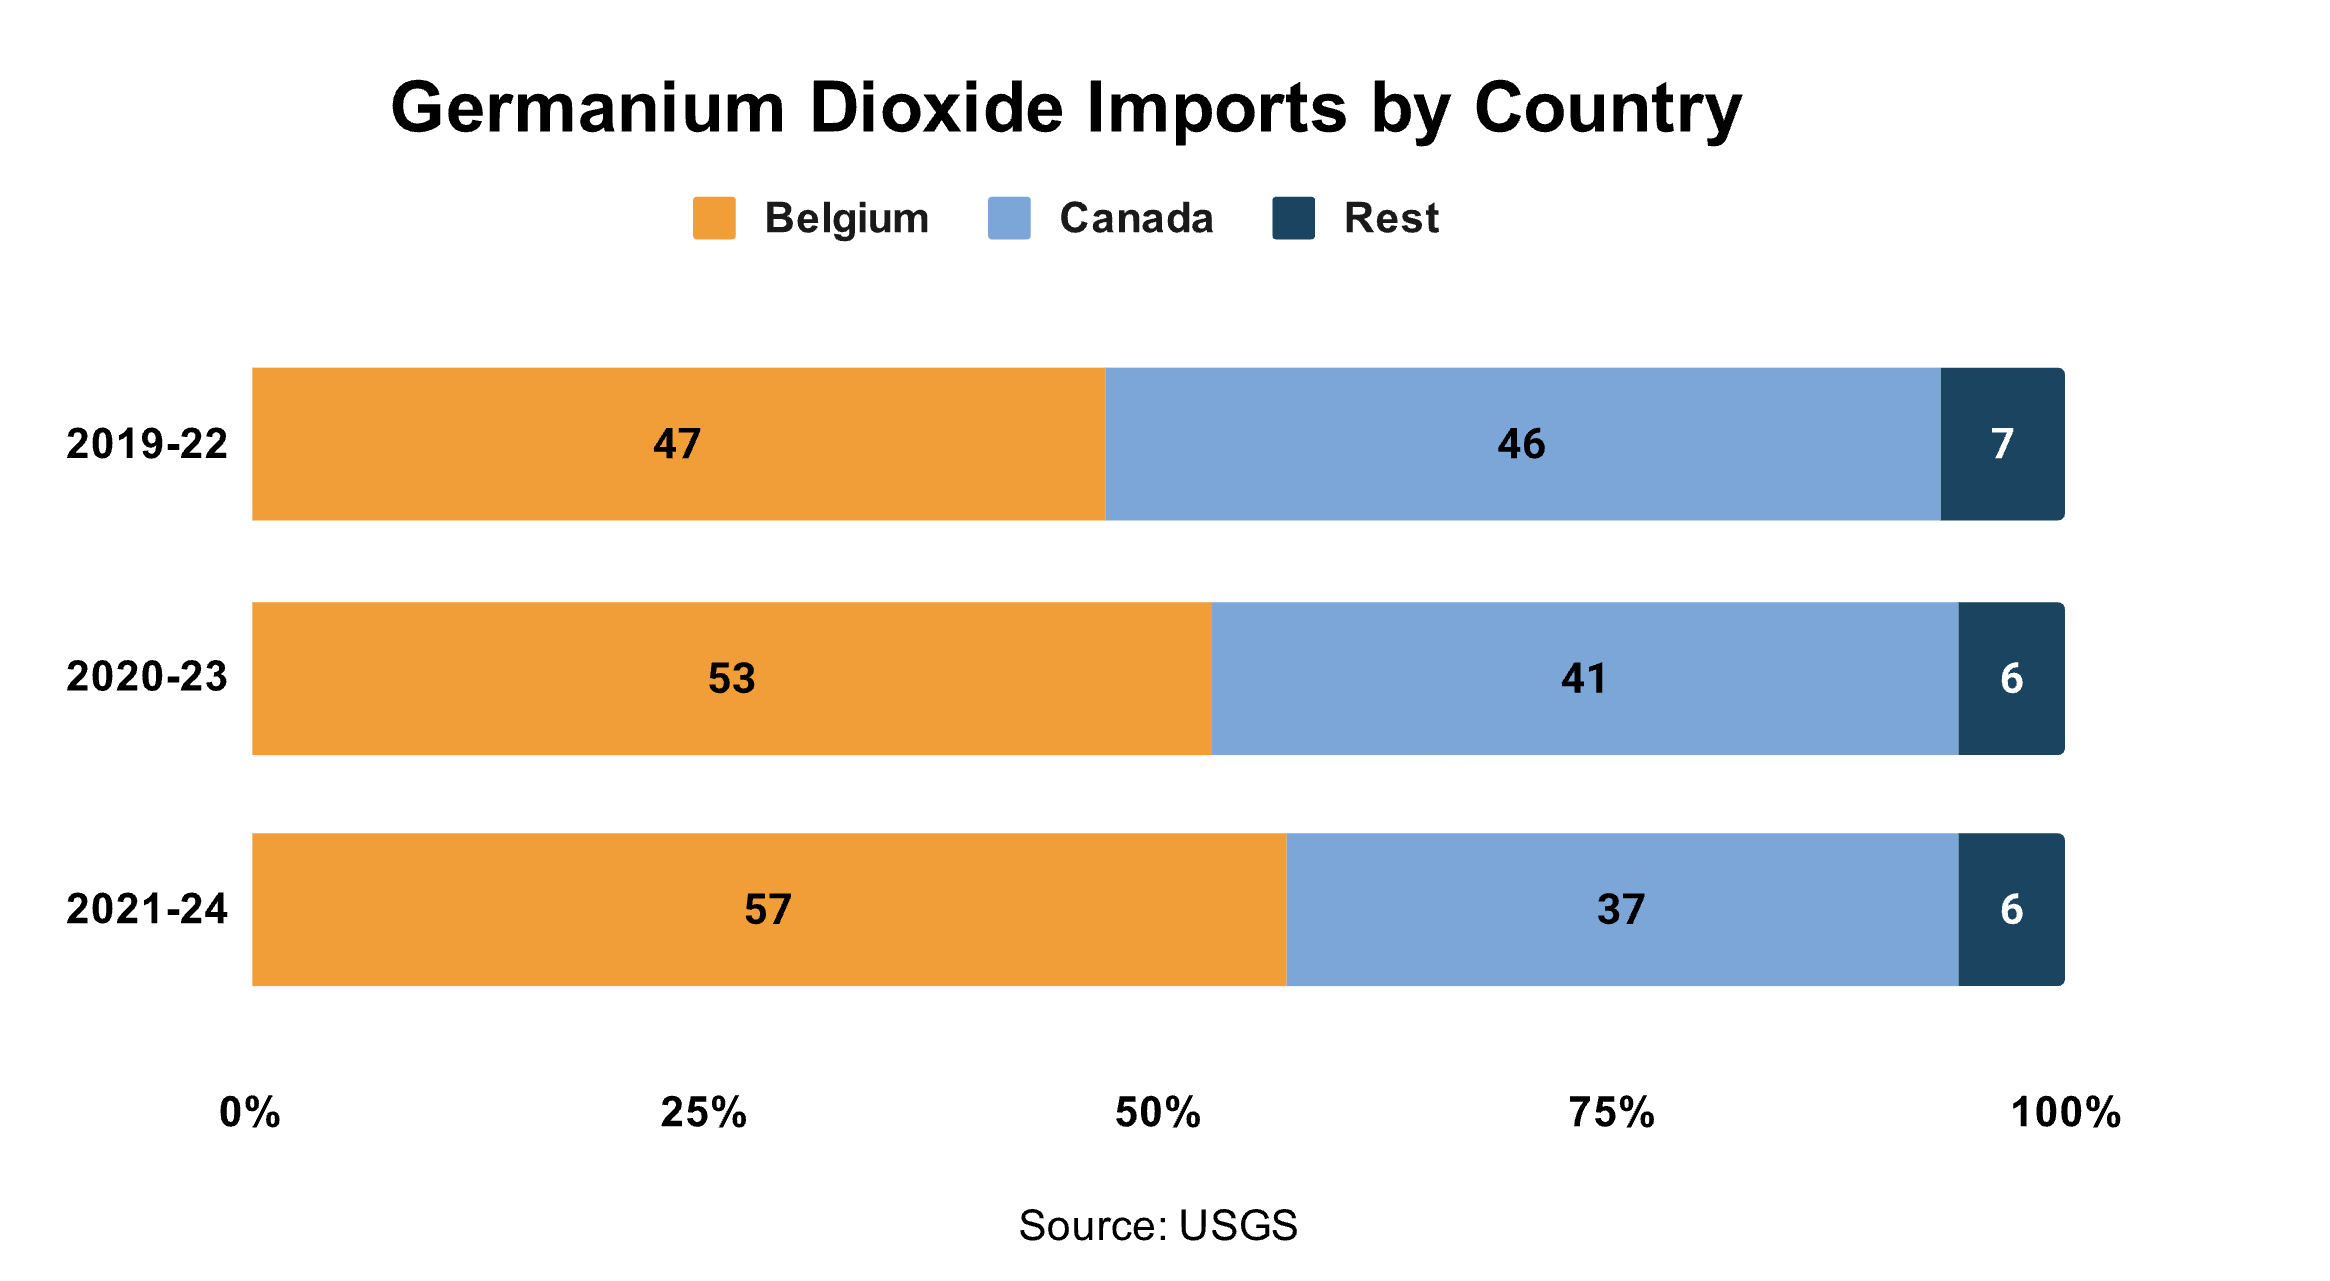
However, China does not figure as a significant source of imports for germanium dioxide. In fact, Belgium and Canada alone account for over 93 per cent of the US imports of germanium dioxide.
Figure 14: Germanium Import Dependence (Combined) by Country
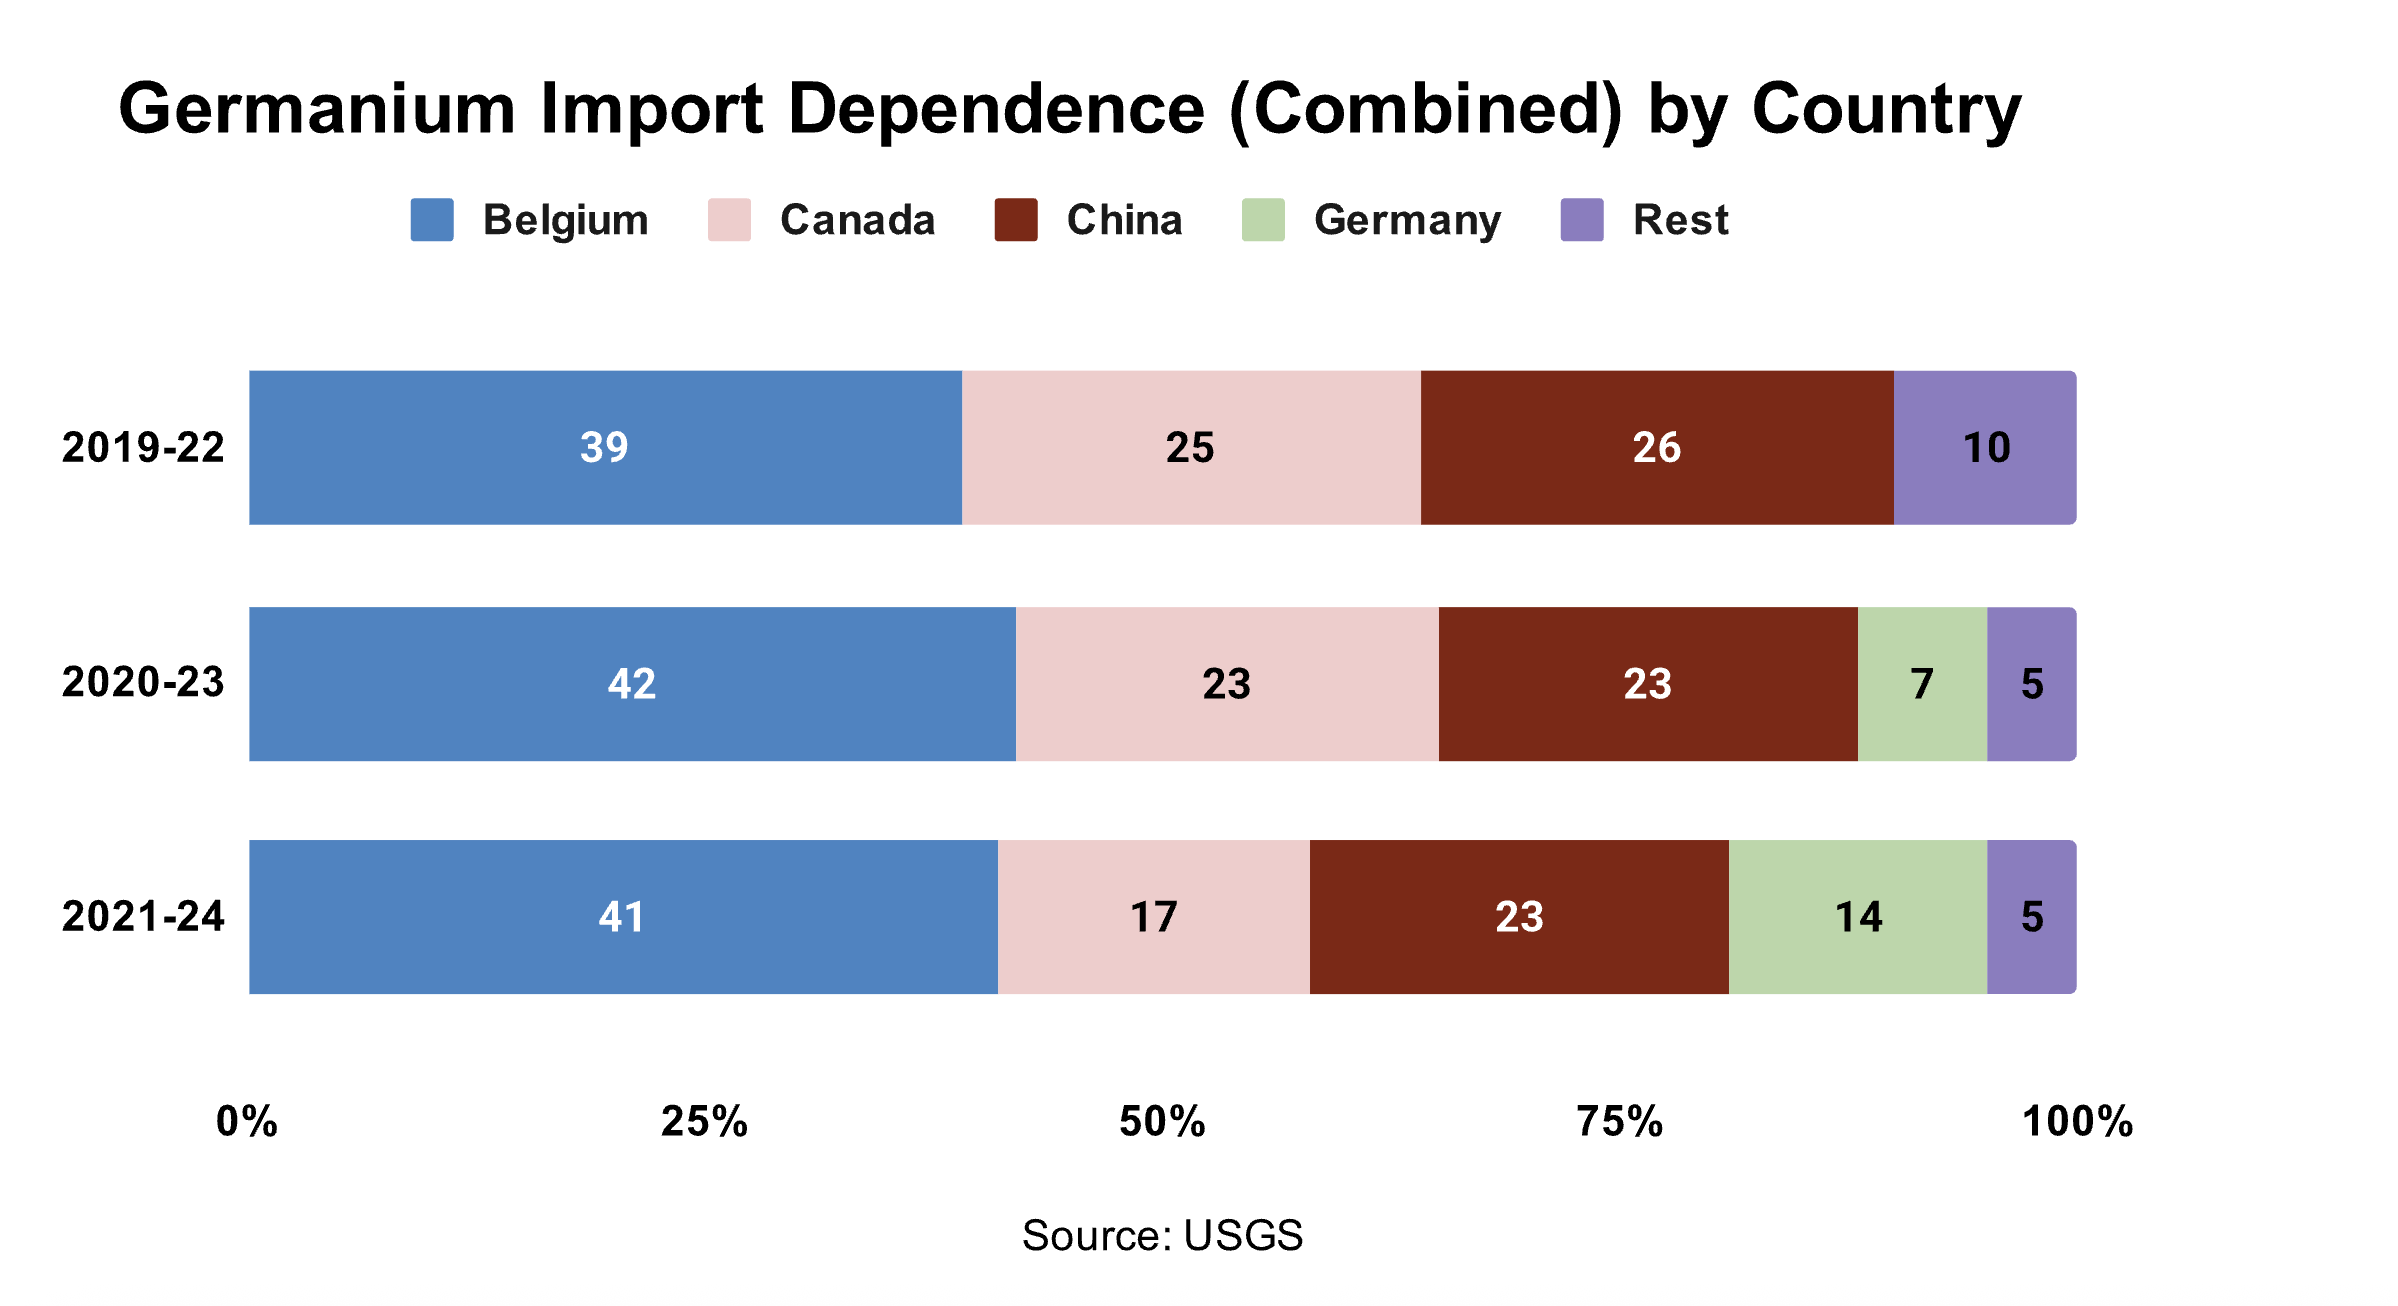
While measuring overall dependence, China makes up for under a quarter of US imports. This perhaps mitigates the impact of Beijing’s export restrictions on germanium.
Moreover, the US has a significant domestic capacity. A facility in Alaska mines germanium-rich zinc concentrates that are exported to Canada for further processing. In addition, the US possesses an extensive recycling capacity to recover germanium from both pre-consumer and post-consumer germanium scrap. For instance, infrared lenses and windows from decommissioned military equipment are routinely recycled to recover germanium. Further, machining scrap from the production of infrared germanium optics and optical fibres is also recycled. Lastly, germanium wafers used as substrates for solar cells are reclaimed for reuse.
Germanium’s substitution with an alternate material is also possible in certain applications. For instance, silicon or gallium arsenide can substitute germanium in certain electronic applications. Further, some metallic compounds can substitute germanium in high-frequency electronics and in some light-emitting-diode applications. Chalcogenide glass has been used as a substitute for germanium metal in infrared applications. Antimony and titanium are substitutes for use as polymerisation catalysts.
4.3 Price Volatility
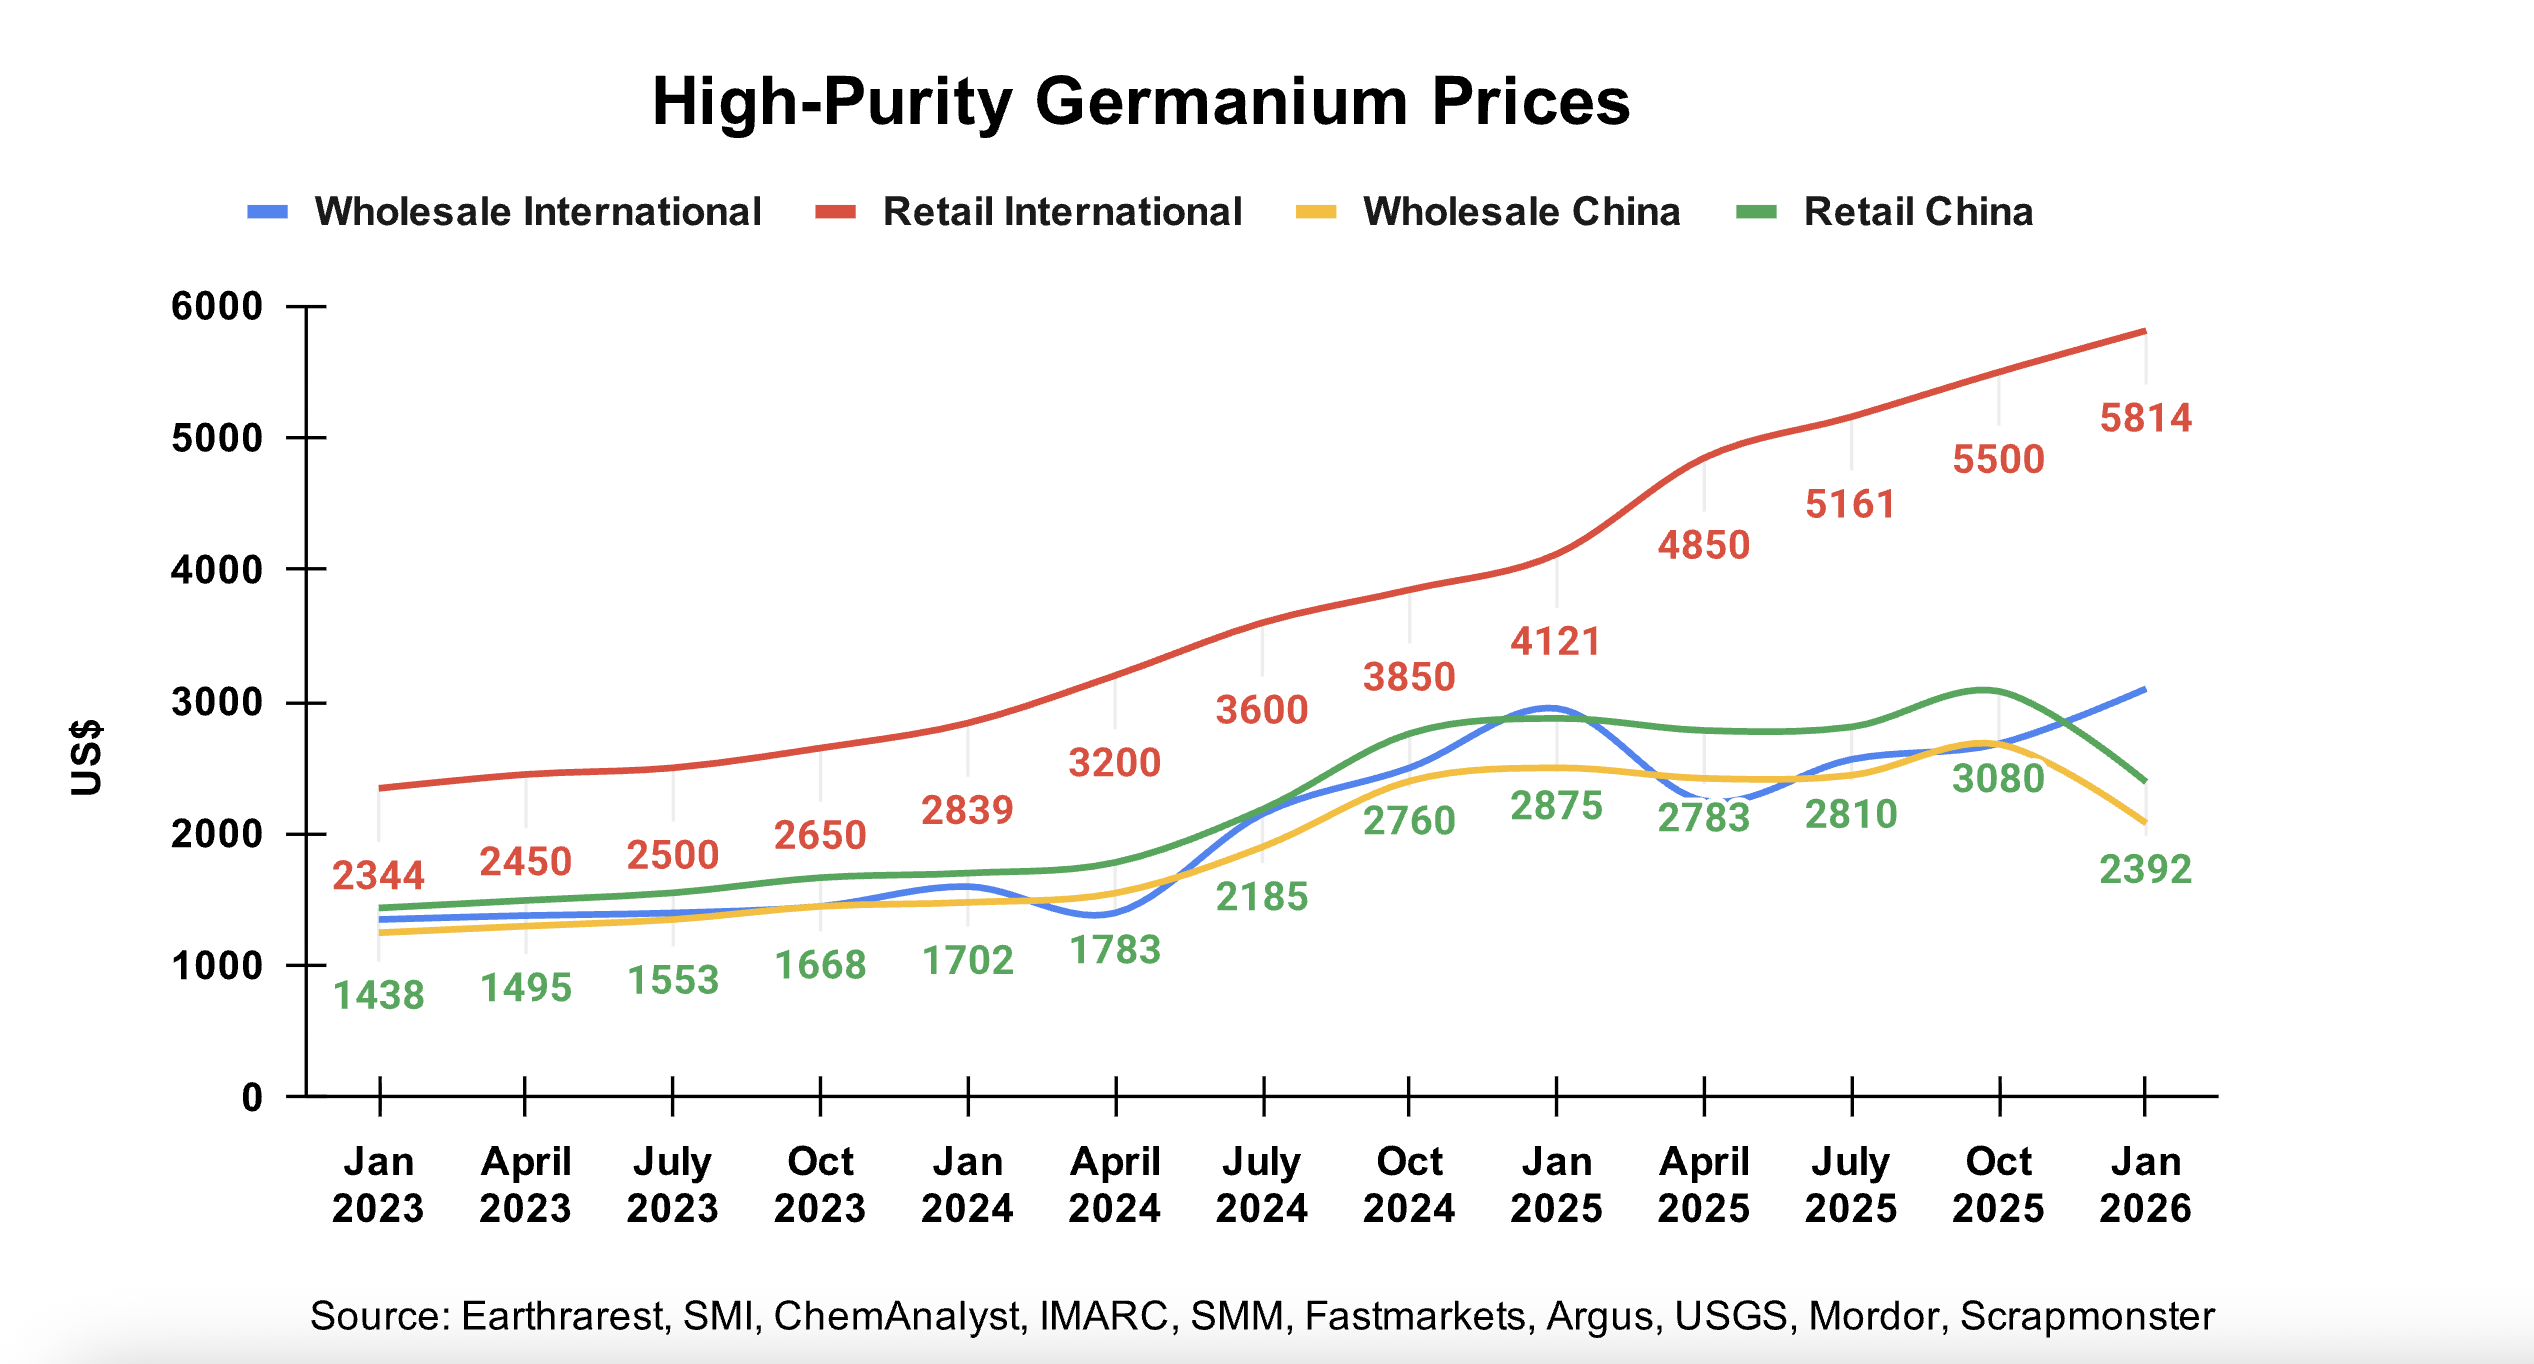
China isn’t as dominant a player in the production of germanium, as it accounts for only 60 per cent of global production. Yet, international retail prices of high-purity germanium have appreciated two-and-a-half times since January 2023. By January 2026, international wholesale prices for high-purity germanium were 2.2 times higher than those in January 2023. The prices in China also appreciated substantially during this period.
Figure 15: High-Purity Germanium Prices
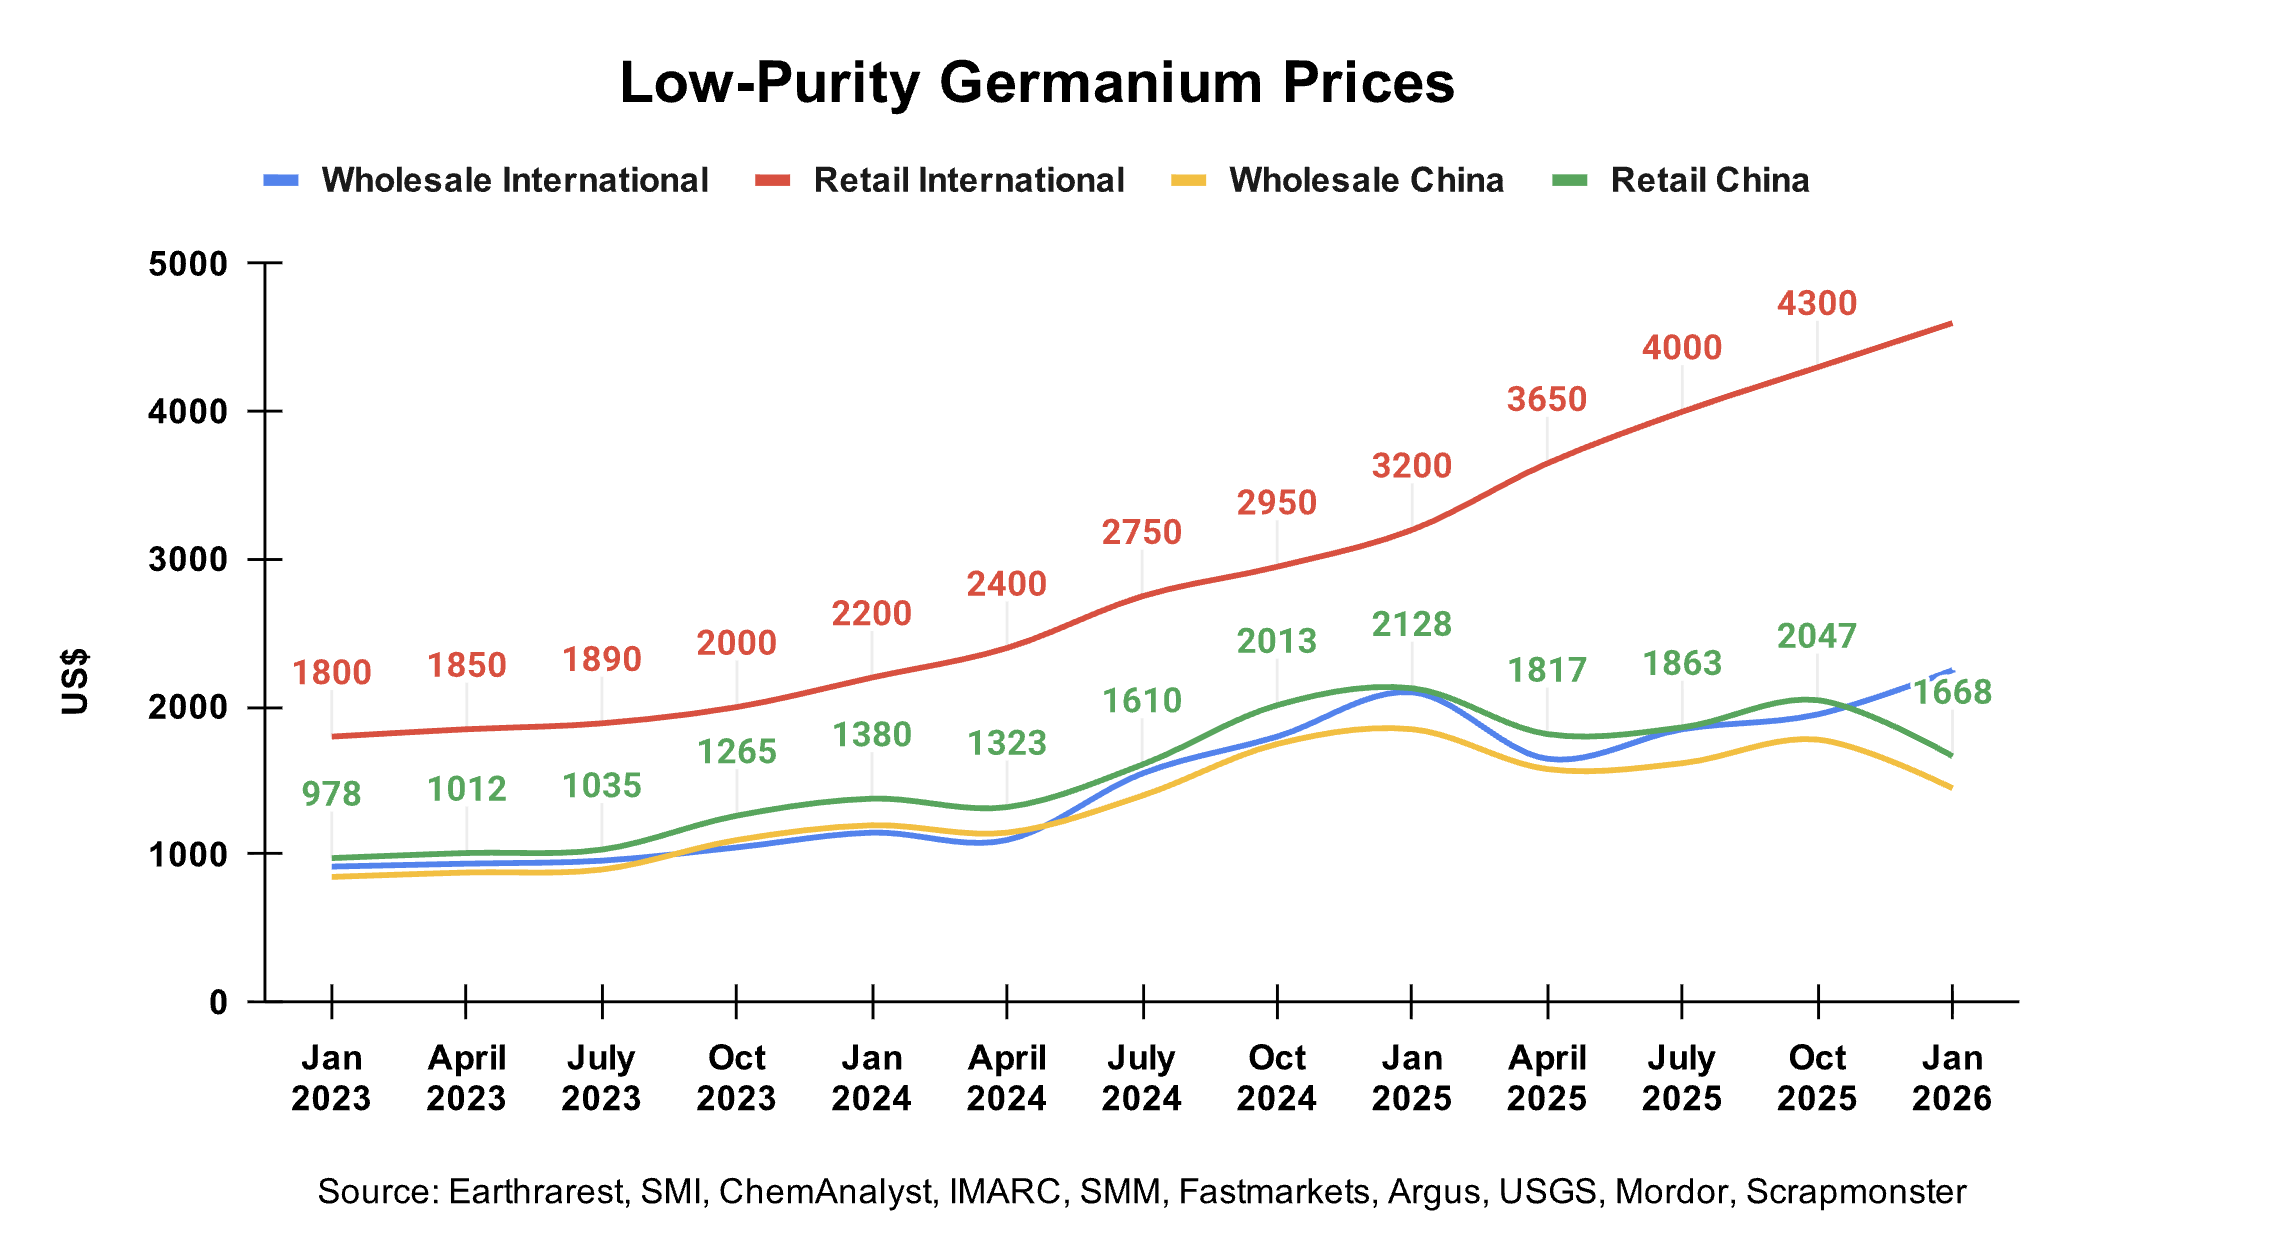
The trend was largely similar for low-purity germanium. International retail prices in January 2026 were at least two-and-a-half times higher than in January 2023. International wholesale prices of low-purity germanium also witnessed a 2.4 times increase in the three-year period.
Figure 16: Low-Purity Germanium Prices
According to USGS, the US has experienced a significant increase in annual average prices of germanium metal and germanium dioxide in 2024. After the total ban came into effect in December 2024, the average import prices of germanium for the US increased sharply.36
Figure 17: Average Germanium Price Reported by US
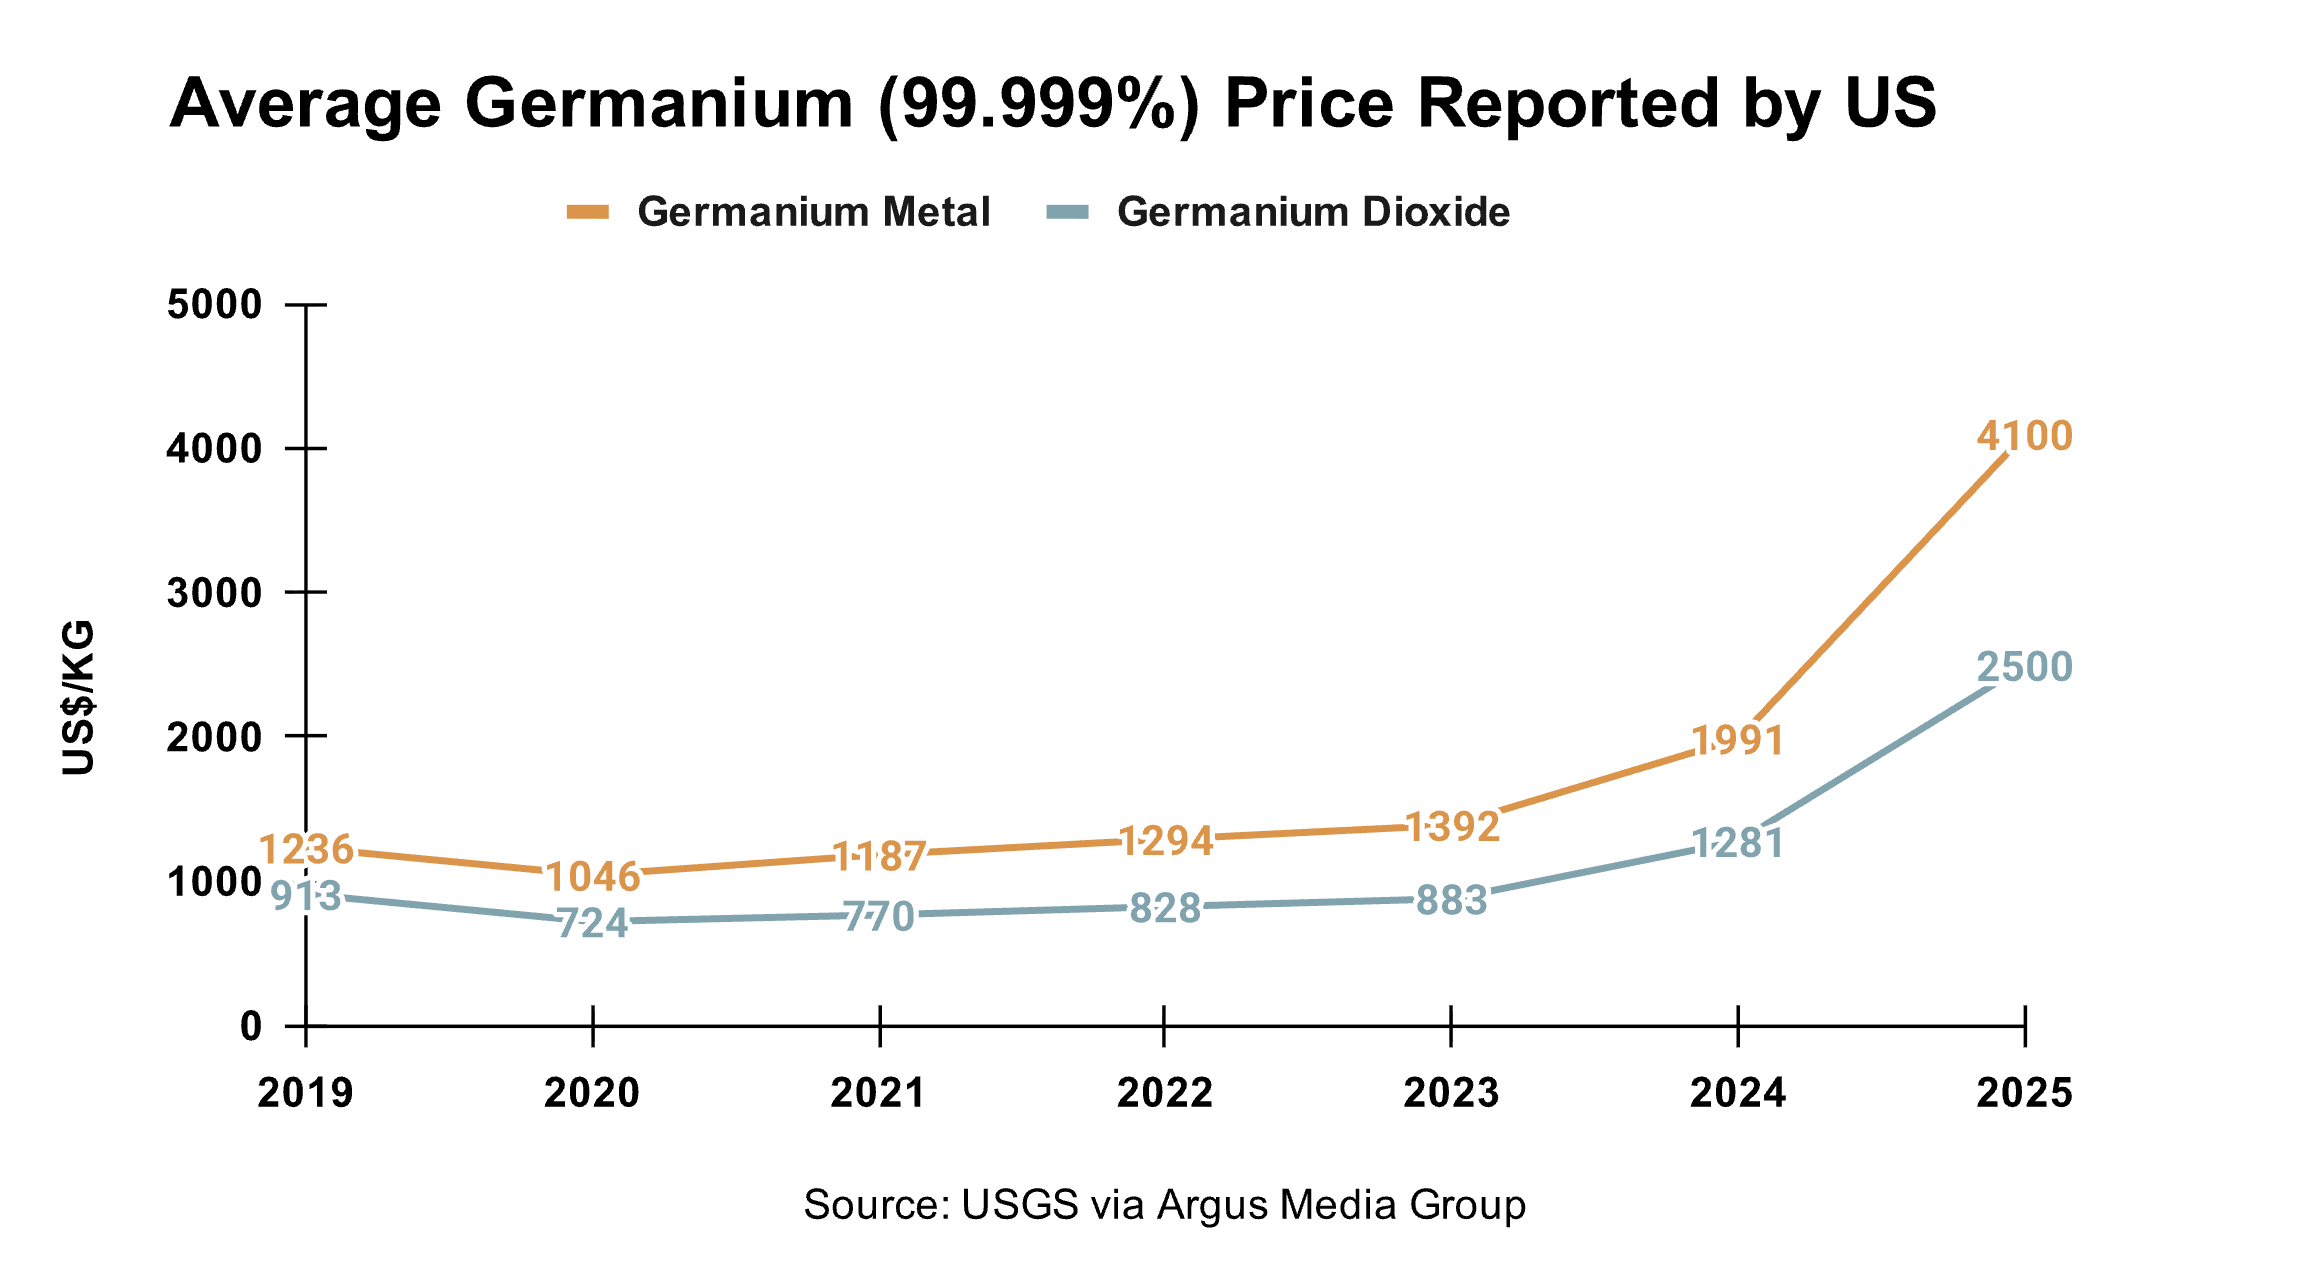
The data suggests that in 2024 and 2025, China succeeded in inflicting economic cost on the US. Nevertheless, the US consumption of germanium does not seem to have been impacted at all.
5. Conclusion
Geo-economics, alongside geopolitics, now increasingly defines the US-China rivalry. Semiconductors, rare earths, and critical minerals have emerged as the linchpins of the new battlegrounds where the struggle to gain and restrict access is unfolding.
The overarching trend to have surfaced in this regard is the frequent weaponisation of resources. Consequently, export controls have become increasingly popular as a tool of economic coercion. There’s a greater conviction, both within the US and China, that dependence, if plausible, must be weaponised to protect strategic interests. Each of the two biggest economies now operates an expansive coercive economic toolkit, which they are constantly improving upon and perfecting to inflict greater damage on the other.
The case study of gallium and germanium is instructive in this regard and offers a few insights. Recourse to export controls will undoubtedly increase economic costs for the target entity—the US, in this case. The average price paid by the US for gallium and germanium during the two-and-a-half-year period, which saw the imposition of export controls and bans by China, rose sharply.
Beyond inducing a price spike, the effectiveness of the export measures remained limited. To begin with, the divergence of interests between the government and businesses perhaps also undermined the intended objective. A lack of alignment in their respective interests often gives way to black marketing, smuggling, and rerouting. Further, a single-country ban undermines the effectiveness of export controls by allowing leakage via a third country.
But there is another factor, much more significant, that determines the effectiveness of export controls. It pertains to whether dependence is a result of market forces or a significant capability differential. Conversely, a lack of alternatives could be a function of either market or capability gap.
In cases, where the requisite capability is diffused, but the market acts as an inhibitor, a sustained price rise can break the monopolistic dominance. China’s predominant position in the production of gallium and germanium is a product of its price competitiveness. Hence, the market can solve for the distortion if the prices remain elevated for long.
However, given China’s overwhelming dominance in the global production of these two elements, it can also discourage such substitution efforts by flooding the global market with cheap supplies.
Consequently, in such a scenario, state intervention becomes key to mitigating the impact and building resilience. Besides offering subsidies, the options range from acquiring equity stakes in enterprises that are potential alternatives, assuring a minimum price floor for emerging alternatives, and providing preferential market access by mandating domestic content requirements. The US has already experimented with some of these.
However, for the market and the state to work in tandem to break the monopolistic dominance of the coercive state requires one precondition: the differential capability—gap between the coercive and dependent country or the rest of the world is not significantly high. If the differential capability is significant, as in the case of advanced photolithography tools, export control can be relatively effective. If not, export restrictions may fail to achieve the desired results. Beijing’s dominance of gallium and germanium belongs to the latter category. Its sustained weaponisation of resources is likely to trigger greater global diversification in the long run.
Footnotes
Ministry of Commerce of the People’s Republic of China. Link.↩︎
Ministry of Commerce of the People’s Republic of China. Link.↩︎
U.S. Geological Survey, Mineral Commodity Summaries 2025: Gallium, by USGS, Reston, VA: US Department of Interior, 2025. Link.↩︎
U.S. Geological Survey, Mineral Commodity Summaries 2025: Germanium, by USGS, Reston, VA: US Department of Interior, 2025. Link.↩︎
U.S. Geological Survey, Mineral Commodity Summaries 2025: Gallium.↩︎
U.S. Geological Survey, Mineral Commodity Summaries 2025: Germanium.↩︎
Ministry of Commerce of the People’s Republic of China. Link.↩︎
Ministry of Commerce of the People’s Republic of China. Link. “China suspends, then bans exports of gallium, germanium, antimony to US,” Reuters, November 9, 2025. Link.↩︎
Ministry of Commerce of the People’s Republic of China. Link.↩︎
U.S. Geological Survey, Mineral Commodity Summaries 2025: Gallium.↩︎
U.S. Geological Survey, Mineral Commodity Summaries 2025: Gallium.↩︎
U.S. Geological Survey, Mineral Commodity Summaries 2025: Gallium.↩︎
U.S. Geological Survey, Mineral Commodity Summaries 2024: Gallium, by USGS, Reston, VA: US Department of Interior, 2024. Link.↩︎
U.S. Geological Survey, Mineral Commodity Summaries 2025: Gallium.↩︎
U.S. Geological Survey, Mineral Commodity Summaries 2026: Gallium, by USGS, Reston, VA: US Department of Interior, 2026. Link.↩︎
U.S. Geological Survey, Mineral Commodity Summaries 2021: Gallium, by USGS, Reston, VA: US Department of Interior, 2021. Link. U.S. Geological Survey, Mineral Commodity Summaries 2022: Gallium, by USGS, Reston, VA: US Department of Interior, 2022. Link. U.S. Geological Survey, Mineral Commodity Summaries 2023: Gallium, by USGS, Reston, VA: US Department of Interior, 2023. Link. U.S. Geological Survey, Mineral Commodity Summaries 2024: Gallium, by USGS, Reston, VA: US Department of Interior. U.S. Geological Survey, Mineral Commodity Summaries 2025: Gallium. U.S. Geological Survey, Mineral Commodity Summaries 2026: Gallium.↩︎
Cullen S. Hendrix, “China’s export controls on critical minerals aren’t ‘starving’ the outside world—yet,” PIIE, July 11, 2024. Link.↩︎
Hendrix, “China’s export controls on critical minerals.”↩︎
U.S. Geological Survey, Mineral Commodity Summaries 2026: Gallium.↩︎
U.S. Geological Survey, Mineral Commodity Summaries 2025: Gallium.↩︎
U.S. Geological Survey, Mineral Commodity Summaries 2026: Gallium.↩︎
U.S. Geological Survey, Mineral Commodity Summaries 2025: Gallium.↩︎
U.S. Geological Survey, Mineral Commodity Summaries 2025: Gallium.↩︎
U.S. Geological Survey, Mineral Commodity Summaries 2026: Gallium.↩︎
“Australia-based Metallium is ready for more electronic scrap,” Recycling Today, February 3, 2025. Link.↩︎
U.S. Geological Survey, Mineral Commodity Summaries 2026: Gallium.↩︎
U.S. Geological Survey, Mineral Commodity Summaries 2025: Germanium, by USGS, Reston, VA: US Department of Interior, 2025. Link.↩︎
Calculations based on USGS data.↩︎
U.S. Geological Survey, Mineral Commodity Summaries 2025: Germanium. U.S. Geological Survey, Mineral Commodity Summaries 2024: Germanium, by USGS, Reston, VA: US Department of Interior, 2024. Link.↩︎
U.S. Geological Survey, Mineral Commodity Summaries 2026: Germanium, by USGS, Reston, VA: US Department of Interior, 2026. Link.↩︎
U.S. Geological Survey, Mineral Commodity Summaries 2024: Germanium. U.S. Geological Survey, Mineral Commodity Summaries 2023: Germanium, by USGS, Reston, VA: US Department of Interior, 2023. Link.↩︎
U.S. Geological Survey, Mineral Commodity Summaries 2025: Germanium. U.S. Geological Survey, Mineral Commodity Summaries 2024: Germanium.↩︎
U.S. Geological Survey, Mineral Commodity Summaries 2026. Germanium.↩︎
U.S. Geological Survey, Mineral Commodity Summaries 2021: Germanium, by USGS, Reston, VA: US Department of Interior, 2021. Link. U.S. Geological Survey, Mineral Commodity Summaries 2022: Germanium, by USGS, Reston, VA: US Department of Interior, 2022. Link. U.S. Geological Survey, Mineral Commodity Summaries 2023: Germanium, by USGS, Reston, VA: US Department of Interior, 2023. Link. U.S. Geological Survey, Mineral Commodity Summaries 2024: Germanium; U.S. Geological Survey, Mineral Commodity Summaries 2025: Germanium. U.S. Geological Survey, Mineral Commodity Summaries 2026: Germanium.↩︎
U.S. Geological Survey, Mineral Commodity Summaries 2026: Germanium.↩︎