Geopolitics of Fertiliser Supply in India
Authors
Executive Summary
India’s dependence on imported fertilisers — approximately 18 million tonnes annually — exposes the country to significant geopolitical risk through its reliance on vulnerable maritime chokepoints. This paper maps the supply chains, shipping routes, and chokepoint exposures for India’s three primary fertiliser nutrients: Nitrogen (Urea), Phosphorus (DAP), and Potassium (MoP). Key supplier nations include Saudi Arabia, Morocco, Russia, Canada, and Jordan, with shipments transiting critical chokepoints such as the Strait of Hormuz, the Bab el-Mandeb, the Suez Canal, and the Strait of Malacca. The paper documents growing threats to these routes, including armed conflict, Houthi attacks, and GNSS spoofing incidents, while also flagging the risks of concentrated supplier dependence. In response, the paper proposes a layered strategy: in the short term, diversifying sources and routes and expanding strategic reserves from the current 30–45 days to 60–90 days of supply; and in the long term, reforming India’s deeply distorted fertiliser subsidy structure by bringing urea under the Nutrient Based Subsidy framework, phasing out subsidies over a decade, and deploying precision agriculture technologies to reduce overall demand. The paper argues that addressing both external supply vulnerabilities and domestic demand distortions is essential for India to achieve durable fertiliser security.
1 Introduction
It appears that, like in the nineteenth century, geographical chokepoints and sea routes have become salient once again. Even as warfare has moved from trench and tank warfare of the last century to ballistic missiles, missile shield systems and armed drones, the geography of shipping has come back to focus.
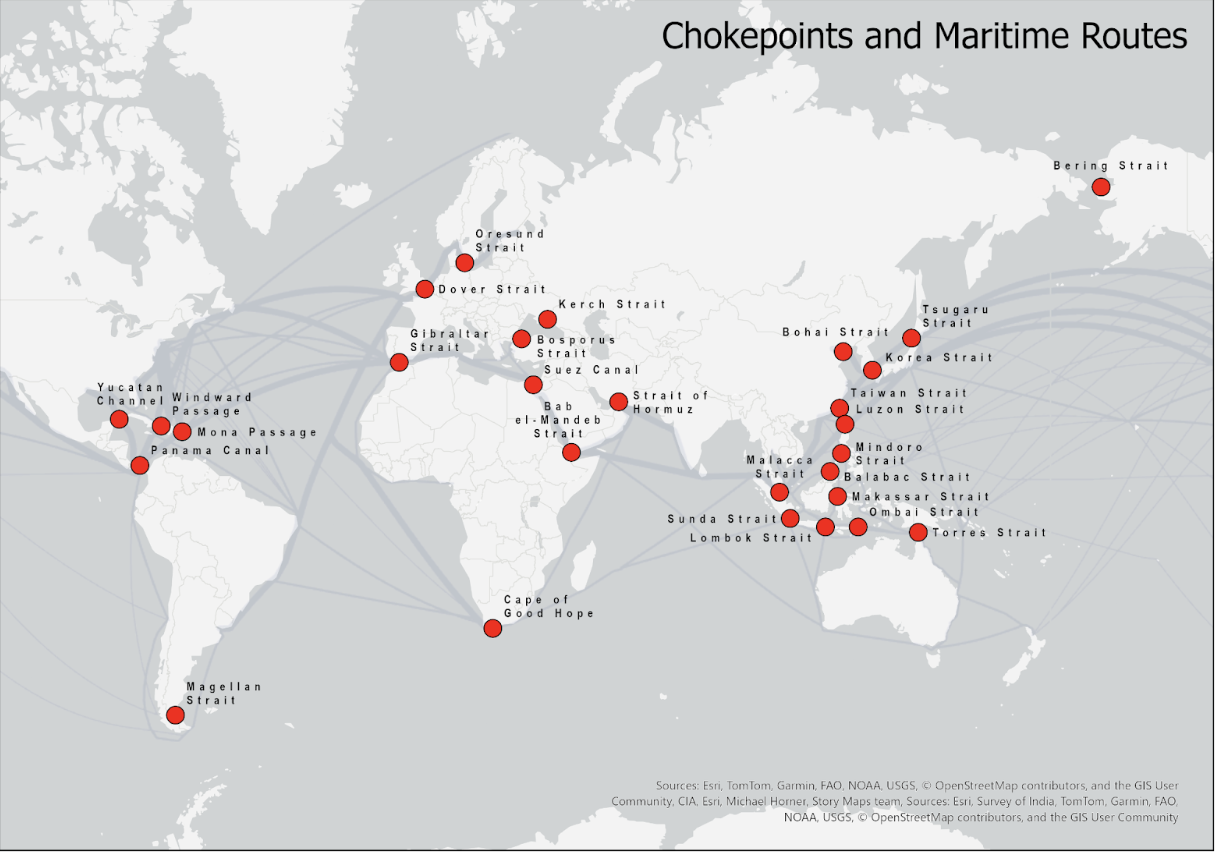
There are 28 chokepoints/hubs plotted on Figure 1, out of which 13 are major, and 15 are minor chokepoints/hubs.1 From west to east, the major chokepoints are the Panama Canal, Gibraltar Strait, Dover Strait, Oresund Straits, Bosporus Strait, Suez Canal, Bab el-Mandeb Strait, the Strait of Hormuz, the Malacca Strait, the Lombok-Makassar Strait, the Ombai Strait, the Taiwan Strait, and the Korea Strait. The other 15 are the Strait of Magellan, Florida Strait, Windward Passage, Yucatan Channel, Mozambique Channel, Cape of Good Hope, Palk Strait, Sunda Strait, Torres Strait, Luzon Strait, Bohai Strait, Tsushima Strait, Tsugaru Strait, Soya (La Pérouse) Strait, and Osumi Strait. In maritime trade routes, the thickness of grey lines in Figure 1 indicates vessel density.
2 Supply, Demand & Routes for Imported Fertiliser in India
India uses roughly 60 million tonnes of fertiliser per year, and about 30 per cent of this is imported. This is an average figure, and the dependency varies sharply by nutrient. Fertiliser is generally consumed as Urea (N for Nitrogen), Diammonium Phosphate (P) and Potassium (K). This is what many people recognise as the N, P, K in fertiliser terminology.
India imports roughly 18 million tonnes of fertiliser a year. Most of this is either inputs or finished products that result in DAP and Muriate of Potash (MoP). DAP contains about 46 per cent Phosphorus in the form of Phosphorus Oxide (P₂O₅) and about 18 per cent Nitrogen. It is primarily made by combining Phosphoric Acid with Ammonia. Phosphoric acid, in turn, is made by reacting phosphatic rock with sulphuric acid. MoP primarily contains Potassium Chloride (KCl). The ore is milled to separate Potassium Chloride from naturally occurring salt (NaCl). India imports about 60 per cent of its Phosphorus requirement since it does not have meaningful phosphate rock reserves. India imports almost all of its MoP since it has virtually no potash deposits. Furthermore, the imported price of DAP is often lower than importing Phosphoric Acid (liquid) and then converting it on shore to DAP.
2.1 The DAP Source, Chokepoints and Route
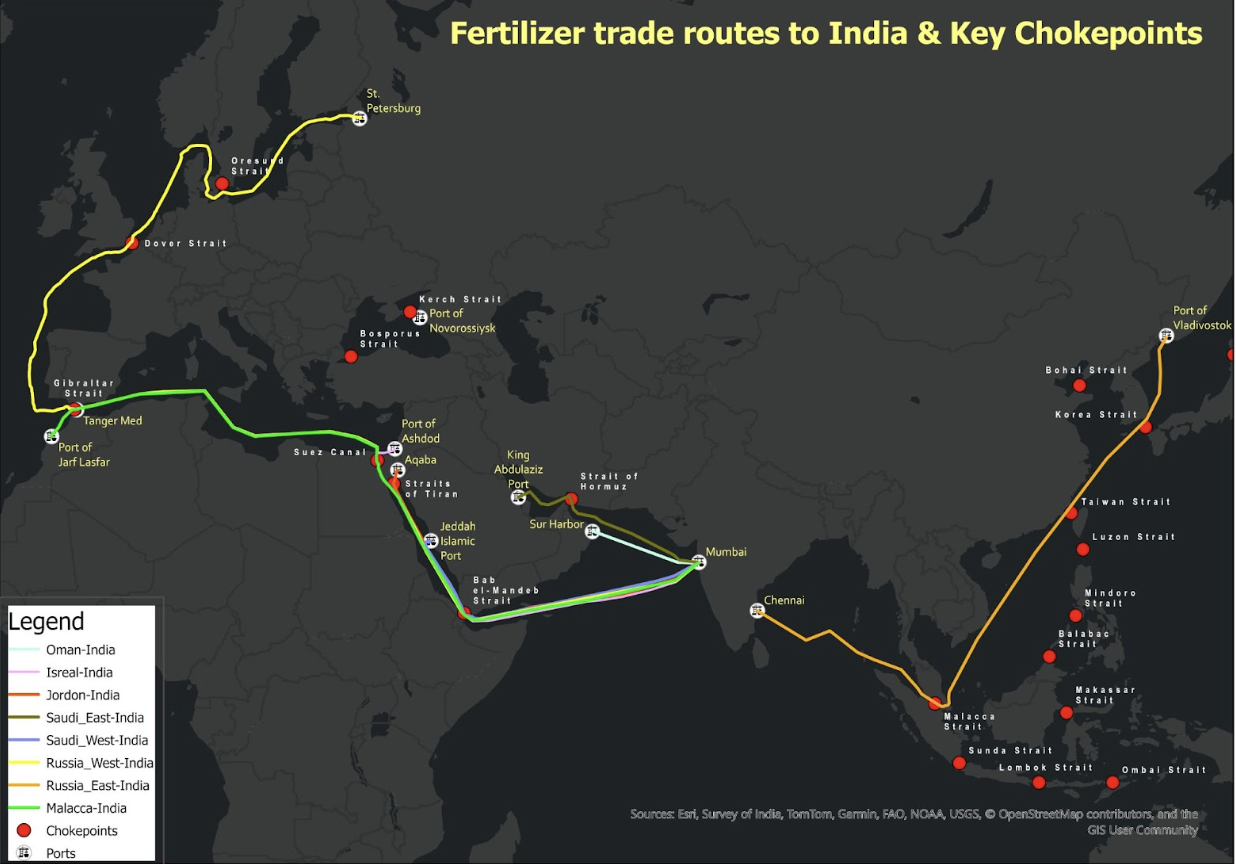
India imports DAP mostly from Saudi Arabia, Morocco, China, Russia and Jordan. Saudi Arabia produces DAP primarily at two major phosphate hubs, Wa’ad Al Shamal in the North and Ras al Khair on the east coast. Even though these two areas are separated by about 1200 km, the two complexes are connected via a massive phosphate export system through the Ras al Khair port on the Persian Gulf. The sea route from the Ras al Khair port to the West Coast of India necessarily passes through the Strait of Hormuz. Given the bulk nature of the mineral, there is no practical option of using a Red Sea port as an alternate route.
Russia’s manufacture of DAP is close to its northwestern region and transfers to the Baltic ports for onward transit to India, primarily from Ust-Luga and St. Petersburg ports. Russia has emerged as a major source, given the discounted price for Russian DAP versus the more premium product and price from Saudi Arabia.
Moroccan DAP is made in the Jorf Lafzar complex on Morocco’s Atlantic Coast, and shipped from a nearby deep-water port of the same name. It makes its way to India’s West Coast ports through the Strait of Gibraltar, the Alboran Sea, the Mediterranean Sea, the Suez Canal, the Bab el-Mandeb Strait, the Gulf of Aden, and the Arabian Sea.
Jordan makes DAP at its southernmost point in Aqaba. The sea route from Aqaba goes through a narrow sea strip and past the city of Sharm-el-Sheikh in Egypt, and through the Straits of Tiran directly into the Red Sea. Thereafter, it follows the same route as the one from Morocco via the Bab el-Mandeb Strait.
2.2 The MoP Source, Chokepoints and Route
India imports MoP mostly from Canada, Russia, Belarus and Jordan. Russia primarily ships out of the Baltic seaport of Ust-Luga. Since Belarus is landlocked and cannot currently ship out of Klaipeda in Lithuania (because of the Ukraine War), it ships out of the Baltic ports like Ust-Luga and St. Petersburg. The Russian and Belarusian MoP have to transit via the Baltic Sea, the Danish Straits, the North Sea, the English Channel, the Bay of Biscay and the Strait of Gibraltar. Thereafter, they follow the same route as the one from Morocco.
Canada is the most important source of Potash in the form of MoP. Roughly 40 per cent of India’s annual MoP requirements come from Canada. Most of Canada’s potash comes from the world’s largest potash-producing company, called Nutrien, based in Saskatoon, Saskatchewan. Saskatoon is landlocked, so the MoP is bulk-shipped on rail to the West Coast port of Vancouver for further shipment to India. This route circumnavigates the globe from the other side via the Strait of Georgia to the North Pacific Ocean, onward to the South China Sea, the Malacca Strait and then to the Andaman Sea and the Bay of Bengal. This is the longest fertiliser journey to India and takes about 30-35 days.
2.3 The Urea Source, Chokepoints and Route
Even though India has significantly increased its urea production, it still imports about 20 per cent of urea primarily from Oman and the Persian Gulf. India imports the majority of this from a single source in Oman: the OMIFCO plant on the Eastern Coast of Oman in Sur. The OMIFCO plant is partly owned by India and avoids the Strait of Hormuz chokepoint since it sits to the east and south in the Gulf of Oman. While India does import additional quantities from the Persian Gulf, any medium-term shortage can be managed through domestic production and imports from Oman.
3 Representation of Transit Time for Indian Imports Through Key Chokepoints
Table 1: Sea routes & chokepoints through which India imports DAP & MoP fertiliser
| Supplier Country | Primary Route | Transit Time* | Key Chokepoints |
|---|---|---|---|
| Jordan (Aqaba) | Gulf of Aqaba→Red Sea → Bab el-Mandeb → Arabian Sea | 8-10 days | Straits of Tiran, Bab el-Mandeb |
| Saudi Arabia (East) | Strait of Hormuz → Arabian Sea | 4-7 days2 | Strait of Hormuz |
| Saudi Arabia (West) | Red Sea → Bab el-Mandeb → Arabian Sea (alternative) | 8-10 days | Bab el-Mandeb |
| Israel | Ashdod→Mediterranean→Suez Canal→Red Sea→Bab el-Mandeb→Arabian Sea | 14-18 days | Suez Canal, Bab el-Mandeb. |
| Russia (West) | Baltic/Black Sea → Suez Canal → Red Sea → Arabian Sea | 40+ days3 | Suez Canal, Bab el-Mandeb |
| Russia (East) | Vladivostok → South China Sea→ Strait of Malacca → Bay of Bengal | 12-24 days4 | Strait of Malacca |
| Canada | Vancouver/West Coast → North Pacific → South China Sea → Strait of Malacca → Bay of Bengal/Arabian Sea | 20–30 days | Strait of Malacca |
| Morocco | Atlantic coast → Strait of Gibraltar → Mediterranean Sea → Suez Canal → Red Sea → Bab el-Mandeb → Arabian Sea | 18–24 days | Strait of Gibraltar, Suez Canal, Bab el-Mandeb |
* Travel time varies depending on the Indian port of arrival and transit stops. Table compiled using Claude.
It is clear from Table 1 that India’s fertiliser imports must pass through chokepoints such as the Strait of Hormuz (from Saudi Arabia) and the Suez Canal (from Morocco, Israel, Jordan and Russia/Western side of the Arabian Peninsula). Given the vulnerability of chokepoints, conflicts around the world have increased India’s risk in imports.
Table 2: India’s exposure to various chokepoints
| Chokepoint | Width (~at the narrowest point) | India’s Exposure | Control/Risk Factor |
|---|---|---|---|
| Strait of Hormuz | 54 km | Saudi DAP | Iran controls the northern shore; US-Iran tensions |
| Strait of Malacca | 2.8 km | Canadian MoP | Piracy, congestion, and China’s proximity |
| Bab el-Mandeb | 29 km | Moroccan, Jordanian and Israeli DAP | Yemen conflict; Houthi attacks |
| Suez Canal | 265 m | Moroccan, Jordanian and Israeli DAP | Egypt control: potential blockages |
| Strait of Tiran | 6 km | Jordanian DAP | Egypt Control |
Table compiled using Claude.
Importing fertiliser through the narrow straits is currently inevitable; however, India needs to remain vigilant. While the Strait of Hormuz is directly in the conflict zone, the Bab el-Mandeb is also under threat due to the Yemen conflict and Houthi attacks. The Suez Canal and the Strait of Malacca are not in immediate danger, but they are certainly a source of concern given global geopolitical developments.
Another growing risk in navigating chokepoints is GNSS spoofing. Incidents have been increasing along the routes through which fertilisers are transported to India, notably via the Persian Gulf, the Baltic Sea, and the Red Sea (see Figure 3). These fake navigation signals often interrupt smooth passage and could threaten vessel safety and affect the stability of fertiliser supply chains.
4 India’s Options
4.1 Short-term strategy
India is dependent on imports because it does not have a ready source of phosphate rock or Potash mineral deposits. In the short term, the priority must be to reduce chokepoint vulnerability by diversifying both sources and routes.
In the short term, for DAP, India must immediately increase sourcing from Morocco. If the Bab el-Mandeb Strait also becomes risky, the sea route from the Atlantic Coast of Morocco could go around the Cape of Good Hope. India has already moved in this direction: in March 2026, India locked in 2.5 million tonnes of fertiliser from Morocco for the 2025-26 season5, and long-term agreements with Saudi Arabia’s Maaden now secure 3.1 million MT of DAP annually for five years6. India could also increase sourcing from China, particularly from Tianjin province, though China’s own export restrictions make this an unreliable long-term option—DAP imports from China fell sharply from 22.28 lakh MT in 2023-24 to 8.47 lakh MT in 2024-257.
For MoP, India should increase its imports from Canada, which can reach India by many alternate sea routes even if any risk manifests in the Malacca Strait. Canada supplies roughly 40 per cent of India’s annual MoP requirements through Nutrien, based in Saskatchewan. The eastern Russian route from Vladivostok to India, which avoids the Baltic-Suez corridor entirely and takes 12-24 days, should also be actively utilised as a hedge against chokepoint disruption on the western route.
4.1.1 Reducing the Russian dependency
Russia’s share of India’s total fertiliser imports rose to a record 33% in the first half of 2025, and its market share in specific categories is even more concentrated, with imports reaching over 90% in mixed fertilisers and above 85% in nitrogenous lines89. Russia has become India’s single largest foreign supplier of fertilisers. While this may offer price advantages for India post-sanctions, this level of concentration has its own risks, mainly concerning secondary sanctions by the US, which could be expanded from energy imports to other areas such as fertilisers.
This requires a deliberate diversification strategy, such that no single country should account for more than 20-25% of imports in any major fertiliser category. The G2G agreements with Morocco and Saudi Arabia are a step in the right direction, and should be complemented by similar frameworks with Canada (for MoP) and Jordan (for DAP).
4.2 Long-term strategy
4.2.1 Subsidy Reform
The long-term solution is to directly tackle the fertiliser subsidy that results in the overuse of fertiliser. The structure of subsidy is different for Urea (N) and for P&K.
For Urea, the government establishes a fixed MRP and manufacturers/exporters are provided a direct subsidy based on reconciliation of Aadhaar-based sales to farmers. A standard Urea bag of 45kg is fixed at ₹242 per bag. The market price of that bag is about ₹2200. This standard pricing has remained unchanged since 201810. This implies that there is a 90 per cent subsidy per bag that in aggregate, amounts to about ₹1.25 lakh crore for the Union Budget11. This extreme subsidy distorts the demand and causes overuse. It also distorts the nutrient use, with massive overuse of nitrogen compared to phosphorus and potassium.
The NPK application ratio has worsened to 9.8:3.7:1 in 202612, against an agronomic ideal of roughly 4:2:1. Nutrient Use Efficiency is only 35-40%, meaning that most of the applied fertiliser is wasted through leaching and gaseous emissions. More telling, the fertiliser-to-grain response ratio has declined from approximately 1:10 in the 1970s to about 1:2.7, which implies that farmers are using more fertiliser for diminishing yield returns. An estimated 20-25% of subsidised urea is diverted to non-agricultural uses.
4.2.2 A Unified Nutrient Based Subsidy (NBS)
The Nutrient Based Subsidy (NBS) scheme, introduced in April 2010 for P&K fertilisers, was a significant reform that moved away from product-specific pricing toward nutrient-content-based subsidies. Under this scheme, companies set retail prices for the nutrients based on market conditions, while the government provided a per-nutrient subsidy. This allowed the price signals to guide farmers’ behaviour, while still providing financial support. However, the problem was that urea was excluded from the NBS, which created a two track system: a market based system for P&K, while urea remains artificially cheap, which incentivises excessive urea use.
For P&K, the subsidy is per kg of fertiliser sold. For the 2025-26 Rabi (winter) season, the subsidy for Phosphorus is ₹47.96 per kg and ₹2.38 per kg for Potassium.
We propose that urea should also be brought under the NBS framework, where subsidies are calibrated per nutrient content, irrespective of the product. For a smooth transition, as the Economic Survey notes, the government could provide a Direct Benefit Transfer to farmers to compensate for the loss in urea subsidy. Further, the NBS should be allowed to function in the way it is designed without ad hoc interventions by the government with special subsidy packages.
Finally, the per-nutrient subsidy should also be phased out over a 10-year period.
4.2.3 Domestic Alternatives and Demand Reduction
Newer techniques including Nano Urea and slow-release and coated products will improve nutrient use efficiency. This could dramatically reduce nutrient loss and result in lower tonnage (including imports).
India does have identified potash resources. The Geological Survey of India estimates approximately 20,000 million tonnes of probable and possible potash reserves in the Nagaur-Ganganagar basin spanning parts of Hanumangarh, Bikaner, and other districts in Rajasthan13. However, domestic exploration is wrought with problems - deep excavation required, low quality, and environmental concerns. This is a long-term strategy to continue exploring potential avenues for potash extraction.
An underappreciated domestic source is Potash Derived from Molasses (PDM), a byproduct of India’s large sugar and ethanol industry. PDM contains approximately 14.5% potash and has been included under the NBS scheme
Geospatial technology is crucial; India needs to fully integrate micro-level precision agriculture with macro-level geospatial technology to improve efficiency at home. At the farm level, tools like Variable Rate Technology (VRT), IoT soil sensors, and drone-based applications of nano-urea change the way nutrients are delivered from wasteful blanket applications that cause fertiliser overuse to targeted, as-needed delivery. Policymakers can measure and monitor the impact from space, thanks to geospatial tools such as satellite-based crop monitoring and GNSS-enabled supply chain tracking. This helps them manage the country’s 60 million tonnes of aggregate fertiliser demand.
This big-picture approach lets the government make dynamic import forecasts, shows soil problems at the district level so that they can be distributed more effectively, and stops the diversion of highly subsidised urea.
4.2.4 Strategic Reserves and Buffer Stocks
Similar to Crude Oil and LPG, strategic reserves should be created for DAP, MoP and possibly even Phosphoric Acid. Currently, fertiliser PSUs typically hold only 30-45 days’ supply, and the existing Buffer Stocking Scheme covers just 3.5 lakh MT for DAP and 1 lakh MT for MoP, which are quite modest volumes against annual import requirements of roughly 18 million tonnes14 15.
The carrying costs of a physical reserve, which include warehousing, capital lockup, insurance, and management, are non-trivial and must be weighed against the cost of a supply disruption. The fertiliser shock from the Ukraine war in 2022 saw global DAP prices spike from approximately $600 to over $900 per tonne, imposing a cost on India’s subsidy bill that far exceeded what a modest buffer stock would have cost to maintain. The economic case for reserves is strongest for MoP (100 per cent imported, concentrated suppliers, long supply chains) and DAP (60 per cent import-dependent, chokepoint-exposed routes), and weakest for urea (87 per cent domestic self-sufficiency).
Thus, a strategic reserve for fertilisers requires a two-tiered practical approach. The first tier is an expanded operational buffer at major ports, holding 60-90 days of import-dependent fertilisers (primarily DAP and MoP), up from the current 30-45 days. The second tier is a virtual reserve constituted by long-term government-to-government supply contracts with take-or-pay provisions. India has moved toward this with the Saudi Arabia and Morocco agreements, but these should be structured more explicitly as supply guarantees with penalty clauses for non-delivery, rather than simply as long-term offtake agreements.
5 Looking Ahead
The fertiliser shock from the latest war in West Asia has not yet been felt in India. A prolonged conflict and/or a continuing threat to sea routes will impact India significantly. India has done well to build up its Urea capacity and diversify its source of P&K fertilisers. The next major step will be to increase domestic resilience by removing subsidies and planning for true (and optimised) market demand.
Footnotes
U.S. Energy Information Administration (EIA). “World Oil Transit Chokepoints.” Washington, DC: U.S. Department of Energy, 2024. Link.↩︎
EIA. “Country Analysis: Saudi Arabia.” U.S. Dept of Energy, 2023. Link ; Saudi Aramco. Annual Report 2023. Dhahran: Saudi Aramco, 2024. Link↩︎
Mathew, Liz, and Anil Sasi. “New Eastern Route Cuts Down Shipping Time and Costs, Promises to Boost India-Russia Trade.” The Indian Express, December 16, 2024. Link.↩︎
ibid.↩︎
Business Upturn, “India to strike fertiliser deal with Russia, Belarus, and Morocco before Kharif season hits,” March 2026. Link↩︎
Press Information Bureau, Government of India, “Empowering India’s Farmers Through Strategic fertiliser Policy,” August 2025. Link↩︎
DD News, “India secures 86 lakh tonnes of fertiliser through global agreements; domestic P&K production rises to 211 LMT,” March 2026. Link↩︎
TASS, “Russia increases fertiliser supplies to India by 20% in H1 2025,” August 2025. Link↩︎
GTAIC, “India–Russia Imports 2025: Oil, fertilisers & Trade Concentration Trends,” January 2026. Link↩︎
Springer Nature, Pathak, H., et al., “India’s fertiliser policies: implications for food security, environmental sustainability, and climate change,” Regional Environmental Change, May 2025. On the history of NBS and urea pricing policy. Link↩︎
Whalesbook, “India’s Budget Tightens fertiliser Subsidies, Eyes Reform,” February 2026. On the FY 2026-27 budget allocation and NPK ratio. Link↩︎
PIB, “Government Promotes Balanced Use of fertilisers and Sustainable Practices”. Link↩︎
ResearchGate / Academia, “Investment Opportunities for Potash Mining in India as an Import Substitute Mineral.” On GSI reserves estimate of ~20,000 million tonnes.↩︎
Indian Chemical News, “India’s fertiliser Security: Strategic supply options needed,” September 2025. Link↩︎
Department of fertilisers, Government of India, “Phosphatic and Potassic (P&K) Policy.” On the Buffer Stocking Scheme for DAP and MoP. Link↩︎