The AI Investment Cycle
| AUTHOR | Arindam Goswami |
| DATE | July 8, 2026 |
| DOCUMENT | Takshashila Discussion Document 2026-21 |
| VERSION | Version 1.0, July 2026. |
| CATEGORIES | High Tech Geopolitics AI Artificial Intelligence AI bubble |
Executive Summary
This document has been formatted to be read conveniently on screens with landscape aspect ratios. Please print only if absolutely necessary.
Arindam Goswami is a Research Analyst with the High-Tech Geopolitics programme at The Takshashila Institution, Bengaluru.
Artificial Intelligence (AI) investment is running far ahead of AI revenue. This paper argues that this is not unusual, not necessarily irrational, and not necessarily a disaster. Two features define the cycle. First is a circular financing web in which the same money moves between a few firms and reappears as demand. Second is a strategic trap: for any large firm, investing heavily is the dominant choice, because the cost of falling behind is existential while the cost of overinvesting is only financial. Every major firm has made that choice at once, which is why the totals are so large.
The paper uses two frameworks. The Prisoner’s Dilemma framework shows why collective overinvestment is rational. A Technology-Revenue matrix shows that ‘whether AI works as a technology’ and ‘whether today’s bets pay off’ are separate questions.
The core claim is that this is a productive bubble. The infrastructure is highly likely to outlast the firms funding it, as the railways and dark fibre did. The binding constraint on this happening is not capability but diffusion. Whether the investment pays off depends on how fast organisations adopt AI, and adoption happens at human speed.
The author would like to thank Pranay Kotasthane and Bharath Reddy for their valuable comments and feedback.
The author acknowledges the use of generative AI tools and Grammarly for assistance in analysis, copy-editing, and causal loop analysis.
For India, five policy directions follow.
- The IndiaAI Mission’s compute allocation should be reoriented toward inference infrastructure rather than training because inference is where deployment value lies and where a national investment can generate returns without competing with large billion-dollar hyperscaler cycles.
- India should fund adaptation of open-source models rather than proprietary frontier development. This is because open-source model adaptation is a more tractable and durable investment than proprietary frontier development, given that open-weight models now reach near-frontier performance at a fraction of the training cost.
- India should extend its demonstrated capability in digital public infrastructure to an AI integration layer that reduces the institutional barriers to adoption at scale.
- Government AI procurement contracts should have scenario-contingent terms - data portability and multi-vendor requirements - to hedge against the consolidation outcomes that several of the scenarios in this paper imply.
- India should formalise participation in international open-source governance and AI standards bodies to address the geopolitical fragmentation risk that the scale of the AI investment boom is generating.
1. Introduction
Speculative investment booms often go hand-in-hand with big changes in technology. History shows this clearly. This paper does not ask if AI is a bubble, but instead looks at what kind of investment cycle we are in, who is taking the financial risks, what will be left after the cycle ends, and what options should India pursue.
This paper uses research on speculative investment cycles, how tech revolutions are funded through booms and busts, and why general-purpose technologies often bring productivity gains more slowly than investors hope. It does not try to predict which companies will survive or fail, and it does not make forecasts about artificial general intelligence.
The paper moves from symptoms (Section 2) through historical comparisons (Section 3), capital allocation (Section 4), and analytical frameworks (Sections 5-6), to scenario analysis and technology trajectories (Sections 7), causal loop analysis (Section 8), and India’s policy options (Section 9).
2. The Symptoms
High expectations are a normal part of technology investment cycles. Venture capital depends on a few big wins to balance out many losses, so investors often support very optimistic ideas instead of just the likely ones. As a result, companies make bold claims to attract funding, since small improvements cannot justify high valuations. As Shiller argued in Irrational Exuberance1, speculative periods are driven by media hype, new business model thinking, and herd behaviour.
Today’s AI investment cycle stands out for where its capital comes from. In earlier tech booms like dotcom, mobile internet, or cloud computing, most money came from venture capital and growth funds, sometimes with help from public markets. The scale itself has precedents: Britain’s railway mania of the 1840s drew in capital on a similar scale relative to the size of the economy. What is new is that the biggest investments now come directly from large, profitable companies like Microsoft, Alphabet, Amazon, and Meta. For example, Microsoft2 alone is spending $80 billion on AI infrastructure in one year.
High valuations alone do not signal a speculative cycle, because some asset always looks expensive against some benchmark. The clearer warning sign is circular financing: arrangements in which a firm funds its own customers, who then use that money to buy the firm’s products, so the same capital returns as apparent demand. Credibility is manufactured rather than earned, and the money only appears to reflect independent buyers. Section 2.1 sets out the current examples. By this measure, several parts of today’s AI investment scene need close attention.
Still, the current AI situation does not match any past example exactly. Some signs are similar to previous bubbles, but there are also important differences.
2.1 The Circular Financing Web
In September 2025, Nvidia committed to investing up to $100 billion in OpenAI to fund a new generation of data centres. OpenAI, in turn, committed to purchasing millions of Nvidia GPUs for those same facilities. OpenAI’s own CFO, Sarah Friar, acknowledged at the time that “most of the money will go back to Nvidia”3. Goldman Sachs, in a subsequent analysis, estimated that such circular revenue arrangements could represent up to 15% of Nvidia’s total forward revenue by 2027.
OpenAI has committed to purchasing $250 billion in cloud services from Microsoft, struck a multi-year GPU deployment deal with AMD (with AMD granting OpenAI warrants on up to 160 million shares in exchange), and signed multi-billion-dollar infrastructure commitments with CoreWeave (a specialised cloud provider that rents out Nvidia GPU capacity to AI developers) across multiple tranches. In aggregate, OpenAI announced approximately $1 trillion in infrastructure commitments across 2025 against annual revenues of roughly $20 billion.
As The Register documented4, when Nvidia invested capital into OpenAI, a significant portion flowed directly back to Nvidia in the form of GPU purchases. The American Prospect’s analysis5, citing Goldman Sachs data, found that internal revenue and vendor financing together account for only 17% of OpenAI’s operating costs, with external funding comprising 75%.
Describing this mechanism (vendor financing) as a bubble is sometimes imprecise. Vendor financing does exist in capital-intensive industries - Boeing finances aircraft purchases, and energy companies arrange project finance for pipelines. The question is whether the circular arrangements here are obscuring underlying demand or creating it.
The circular financing arrangements create a specific failure sequence. If AI revenue growth disappoints - or if access to capital markets tightens for any reason, including broader macroeconomic shifts - the companies relying on vendor financing cannot continue servicing commitments of this scale from operating cash flows alone, and because these commitments are interconnected, stress in one flows to the others.
The fallout would not be limited to the AI sector. AI-related capital expenditure accounted for approximately 1.1% of US GDP growth in the first half of 20256, meaning a sharp reversal would reduce investment demand, affect construction and manufacturing employment tied to data centre buildout, and flow through to the supply chain - power companies, real estate investment trusts, semiconductor equipment manufacturers, etc.
2.2 The Capital Numbers and the Revenue Gap
The infrastructure investment numbers are, by any historical benchmark, exceptional. According to IDC’s Q4 2025 report7, full-year 2025 global AI infrastructure spending totalled $318 billion - more than double the $153 billion recorded in 2024. The US accounted for 77% of that total. For 2026, CreditSights projects8 that the top five hyperscalers alone will spend $602 billion in capital expenditure, with roughly 75% directed at AI-specific infrastructure.
Goldman Sachs noted9 that consensus estimates for hyperscaler capex have undershot reality for two consecutive years - at the start of both 2024 and 2025, analysts expected roughly 20% growth; actual growth exceeded 50% in both years.
The revenue picture is complicated. OpenAI ended 2025 with around $20 billion in annualised revenue, having tripled year-on-year from $6 billion in 2024 - fast growth by any measure. But internal financial documents reported by Fortune10 project $74 billion in operating losses in 2028 alone, with cumulative losses through 2029 of roughly $115 billion. Reaching profitability by 2030 requires revenue of around $200 billion - a compound annual growth rate of approximately 59% over five years, roughly double the projected growth rate of the entire global AI software market for the same period.
The hyperscalers face a different, and less immediately severe, version of the revenue gap problem. Microsoft, Alphabet, Amazon, and Meta are not facing existential financial risk of the kind foundation model labs face. Their AI capital expenditure is funded from diversified, profitable operating businesses, meaning that they are not dependent on continuous external financing to stay solvent. Failing to invest heavily in AI infrastructure now would cede platform position in a transformative technology. This is a rational assessment, but it is one that every major hyperscaler has made simultaneously, which is why the aggregate investment level is extraordinary.
The financial stress nonetheless exists. CreditSights projects11 that combined hyperscaler capex will reach 94% of operating cash flow after buybacks and dividends in 2025-2026. This means these companies are, in aggregate, approaching the point where AI investment requires external borrowing, rather than being funded entirely from existing operations.
This is different from historically cash-funded business models. While these companies have access to capital on favourable terms, the revenue justification is not strong. These four companies have collectively invested approximately $560 billion in AI infrastructure over 2024-2025, while generating roughly $35 billion in AI-specific revenue. NPV-positive outcomes require the revenue base to expand multifold over the next decade. That is achievable, but the gap between current returns and the scale of capital at risk is large enough that continued deterioration in AI revenue growth would put these companies in a position where the investment case looks harder to sustain.
Bain & Company’s 2025 Global Technology Report12 estimates that sustaining the investment levels currently planned would require the AI industry as a whole to generate $2 trillion in annual revenue by 2030. Even with all AI-driven efficiency savings reinvested back into infrastructure, the industry remains $800 billion short of that threshold.
2.3 Leadership Statements and What They Signal
In November 2025, Alphabet CEO Sundar Pichai told the BBC that the current AI investment surge contains “elements of irrationality”13 and that no company - including Google - would be immune if a bubble burst. Pichai’s language was deliberate14: he invoked Alan Greenspan’s “irrational exuberance” warning, made about equity markets in 1996, four years before the dotcom collapse; he noted that the internet era had also involved large excess investment, and that the internet still proved transformative despite it. A Bank of America survey the same month15 found that more than half of fund managers surveyed believed AI equities were already in a bubble, and 45% cited the AI sector as the biggest tail risk for global markets.
The Greenspan episode contains a lesson that is easy to underestimate: being right about the direction of a speculative excess and being right about its timing are two entirely separate problems. Greenspan’s diagnosis in 1996 was broadly correct - the internet was being overpriced relative to near-term revenue. The investors who acted on that diagnosis immediately lost three more years of upside before the correction arrived. Being analytically correct about a bubble does not tell you when it ends.
The OpenAI episode is more revealing. In November 2025, OpenAI CFO Sarah Friar said publicly at a Wall Street Journal event that she would like the US government to provide “the backstop, the guarantee that allows data centre financing to happen”16 - effectively suggesting government-guaranteed loans for AI infrastructure. The statement attracted immediate political response. Trump’s AI adviser David Sacks responded the same day: “There will be no federal bailout for AI.”17 Sam Altman then posted a lengthy statement18 distancing himself from Friar’s remarks: “We do not have or want government guarantees for OpenAI data centres. We believe that governments should not pick winners or losers, and that taxpayers should not bail out companies that make bad business decisions or otherwise lose in the market.”
When a company with $20 billion in annualised revenue has committed to over $1.4 trillion in spending across an eight-year period, the question of how it finances those commitments is important. The CFO of that company will be looking at every available option. The political response confirmed that government guarantees are not available. With government guarantees ruled out, the question of how OpenAI finances those commitments falls back entirely on continued private capital access - which the revenue gap (as described in this section) makes increasingly uncertain.
3. Historical Parallels and Where They Break Down
The dotcom comparison has become very reflexive in discussions of AI investment. It is, therefore, valuable to analyse where the analogy holds and where it breaks. This section sets the AI cycle against three earlier episodes — the dotcom bubble, the crypto/Web3 boom, and the railway manias — and asks where each analogy holds and where it breaks.
The Hype Cycle’s Relevance - and Its Limits
Gartner’s 2025 Hype Cycle for Artificial Intelligence19 places generative AI in what it calls the “Trough of Disillusionment” - the phase that follows the peak of inflated expectations, where early pilots fail, abandonment rates rise, and the initial frenzy gives way to more realistic assessment. This is Gartner’s standard model for how new technologies diffuse: early hype exceeds delivery, disillusionment follows, and then a slower but durable “slope of enlightenment” begins as use cases emerge.
The hype cycle is a useful qualitative description of technology diffusion dynamics, but it has limits as an analytical tool. It says nothing about the financial structure of the investment cycle - whether the organisations that funded the peak phase can survive the trough - and it implies a smooth progression that actual technology history rarely follows.
3.1 The Dotcom Bubble
The NASDAQ surged 572% between January 1995 and March 2000, then collapsed 78% between March 2000 and October 2002, erasing roughly $5 trillion in market value20. The defining structural feature of that episode was minimal or non-existent revenue at companies commanding billion-dollar valuations.
As Robert Shiller documented in Irrational Exuberance21, speculative bubbles are sustained not by outright irrationality but by a combination of structural amplifiers - media coverage feeding back into prices, “new era” thinking that redefines what counts as a valid business model, and herd dynamics that make individual caution irrational even when collective caution would be rational. All three of those amplifiers are identifiably present in the current AI moment.
The parallel that holds most clearly is infrastructure overbuilding. During the dotcom boom, an estimated 85–95% of the fibre-optic cable laid by US telecoms sat unused at the peak (the dark fibre box below gives the detail). That overcapacity took about a decade to absorb, but it ultimately enabled consumer internet, cloud computing, and e-commerce that followed. Today’s hyperscalers are constructing the AI-era equivalent: compute and energy infrastructure at a scale that current applications cannot fully utilise, but which may prove enabling for applications not yet developed.
Carlota Perez’s framework22 for technological revolutions - her concept of the “installation period”, characterised by decoupling between financial capital and production capital - fits this pattern precisely. In her book Technological Revolutions and Financial Capital (2002), the frenzy phase of each major technological revolution always involves financial capital running ahead of productive deployment. The bubble finances technological development.
Dark Fibre: The Infrastructure That Outlasted Its Investors
The fibre optic analogy for AI infrastructure is often invoked quickly and then left behind. The numbers are worth sitting with. During the dotcom boom, US telecoms companies laid approximately 80 million miles of fibre optic cable at a cost of hundreds of billions of dollars. At the dotcom peak, an estimated 85 to 95% of installed fibre remained “dark”23 (connected but unused), because the applications needed to fill it did not yet exist or had not been deployed.
The companies that built it, like WorldCom and Global Crossing, mostly went bankrupt. The investors who financed the buildout mostly lost their money. But the fibre remained in the ground. By 2003, bandwidth prices had fallen so far that companies could build data-hungry businesses on cheap connectivity that would have been economically impossible before the overinvestment. The infrastructure outlasted the investors by decades. This is the structural pattern Carlota Perez documents across the installation periods of prior technological revolutions.
Greater precision on compute utilisation is necessary here. The claim that infrastructure is being built at a scale current applications cannot fully utilise does not apply uniformly across the AI hardware stack. Bain & Company projects24 inference data centre capacity growing from 2 gigawatts in 2024 to 54 gigawatts by 2030 - a trajectory driven not by speculation but by actual demand, that is already growing fast. Supply of the newest, frontier AI GPUs is tight, and so is the physical space to house them. In Northern Virginia, the largest data-centre market in the US, the colocation vacancy rate — the share of rentable data-centre space sitting empty — fell below 1% in 2024, which means capacity is almost fully taken. Deloitte’s 2026 technology predictions25 project that inference will account for roughly two-thirds of all AI compute by 2026, with training making up the rest. Inference demand has been growing faster than new capacity can be brought online, and it competes with training for the same scarce GPUs and power, so for inference the market is currently supply-constrained.
The overcapacity argument applies more precisely to two narrower claims: first, that enterprise GPU utilisation across corporate AI fleets is frequently well below 50%, with much purchased hardware underused in practice; and second, that the forward infrastructure buildout — the $600 billion-plus in capex being committed for 2026 and beyond — is being sized for agentic AI workloads, multimodal inference at scale, and autonomous agent deployments that have not yet materialised in the volumes required to fill that capacity. The gap is one of timing, not hardware type: the same class of chips is under-supplied for today’s inference demand and, at the same time, being built ahead of the future workloads meant to fill it. You can therefore be short of chips for today’s work while building more capacity than today’s revenue justifies. The distinction matters for how we think about the risk profile of the investment.
The parallel that does not hold is the financial foundation of the major investors. Microsoft, Alphabet, Amazon, and Meta are profitable businesses with diversified revenue streams. Their AI capex, while substantial, is funded from operating cash flow, and not venture capital. The more precise dotcom comparison is between Nvidia and Cisco: Cisco’s shares rose over 1,000% from its IPO to its March 2000 peak, briefly making it the world’s most valuable company at $500 billion, trading at a trailing P/E of 472 times in 1999. Nvidia’s market capitalisation exceeded $3 trillion in 2025, but its forward P/E sits at around 30 times - elevated, but anchored in actual earnings26.
Google and Meta are financing their AI infrastructure entirely from operating cash flows generated by advertising and cloud businesses that have nothing to do with AI. Their AI spending is a discretionary allocation from profitable operations. Microsoft’s situation is similar. These companies face the risk of having allocated capital poorly if AI revenue disappoints.
OpenAI and Anthropic face a structurally different risk. They are not self-funding. OpenAI’s path to profitability depends on growing revenue at roughly 59% per year compounded over five years, while continuing to access capital markets on favourable terms throughout that period. Anthropic’s trajectory is more conservative but similarly dependent on external financing. Neither company is profitable today; neither is close to it.
The relevant comparison for these two companies is not Cisco, but rather the telecom operators who borrowed heavily to fund fibre buildout in the 1990s and were wiped out when the revenue assumptions underlying those loans proved wrong. The Cisco comparison is apt for Nvidia; it is the wrong template for the foundation labs.
3.2 The Crypto/Web3 Episode
The structural parallel between AI and the crypto/Web3 episode is circular, narrative-driven investment. Shiller’s concept of “moral anchors” - the narratives that convince investors to hold rather than sell - applies to both cases. In crypto it was decentralised finance transforming the global banking system, while in AI it is the imminence of artificial general intelligence or, more concretely, platform dominance in a multi-trillion dollar software market.
The important difference is in terms of utility, that is, who is actually using the technology. Web3’s ratio of speculative trading to underlying economic activity was estimated at over 1000:1 at its peak. AI has no equivalent problem. According to McKinsey’s State of AI 202527, 78% of enterprises now use AI in at least one business function - up from 55% in 2023. Coding assistants have achieved 50% daily usage among developers. JPMorgan’s enterprise coding assistant improved engineer productivity by 10-20% across tens of thousands of staff.
A NBER working paper by Brynjolfsson, Rock, and Syverson (2017)28 on AI and the modern productivity paradox argued that the most impressive capabilities of AI have not yet diffused widely, but that - like prior general-purpose technologies - the full effects will only be realised after waves of complementary innovations are developed and implemented. That paper coined the “Productivity J-Curve” concept: early-stage GPT adoption tends to register as stagnant or even negative in productivity statistics precisely because organisational restructuring costs outrun near-term benefits. For AI, this means slow measured productivity reflects the pace of organisational change, not an absence of underlying value. That is the opposite of the crypto case, where broad usage never arrived.
3.3 Railway Manias: The First Productive Bubbles
Britain’s railway mania of the 1840s is an early case of the pattern this paper describes. At its 1845-46 peak, planned railway investment reached roughly 7% of British GDP - about half of all investment in the economy. Parliament authorised around 3000 miles of track in 1845 alone, close to the total of the previous fifteen years29. Share prices roughly doubled, then fell back as the Bank of England raised rates and promoters’ revenue claims proved optimistic; average dividends came in around 2%, against the 10% investors had been promised. Most original investors lost money. But the track stayed in the ground, and by 1850 Britain had a 6000-mile network30 linking its major cities that carried a century of industrial growth. The capital was destroyed but the asset survived.
The US repeated the pattern on a larger scale, and more than once. American railroads absorbed enormous amounts of investment capital in the decades after the Civil War, financed increasingly through fixed-interest bonds that operating revenue could not always cover. The Panic of 187331 began when Jay Cooke and Company, the banking house financing the Northern Pacific Railway, could not place its railroad bonds and suspended payments. The failure forced the first suspension of trading32 in the history of the New York Stock Exchange and set off a severe multi-year depression. Twenty years later the Panic of 189333 began with the failure of the Philadelphia and Reading Railroad, and by 1897 companies controlling about a third of national railroad mileage34 had passed through bankruptcy.
The cause both times was the same. Track had been laid ahead of demand, on borrowed money, and the traffic did not arrive fast enough to service the debt. Original investors were wiped out, and the surviving lines were reorganised, much of it by J. P. Morgan. But the track stayed down, and the network the bankrupt companies had built moved American freight and passengers for the next half-century. The pattern held on both sides of the Atlantic - the same separation between financial loss and durable infrastructure that the dark-fibre buildout would show again in the 1990s.
The Supplier’s Position: Carnegie and the Railroads
Andrew Carnegie is remembered as a figure of the railroad age, though his fortune came from supplying the railroads, not running them. He had worked as a telegrapher and then a superintendent at the Pennsylvania Railroad, saw how much steel the industry consumed, and moved into producing it35, using the Bessemer process to make rails cheaply.
Carnegie Steel36 grew into the largest producer in the world, held roughly a quarter of global output, and was sold to J. P. Morgan in 1901 for about $480 million to form the core of U.S. Steel. The railroad operators carried the traffic risk and the debt; Carnegie, as the supplier of the essential input into the buildout, sat in a safer position. Nvidia holds the same position in the current cycle. That says nothing about Nvidia’s share price - Section 3.1 uses Cisco to show the input supplier’s own stock can still be overvalued. The claim here is only about where the durable profits of a buildout tend to settle.
4. Where Is the Money Going?
The capital flowing into AI is not a monolith. It is being deployed across four distinct categories - compute infrastructure, energy infrastructure, frontier model R&D, and applications - and these categories have different risk profiles, different return timelines, and different survivability characteristics in a correction scenario. Treating them as a single “AI investment” would be wrong.
A note on categories is required at this point. Nvidia’s Jensen Huang describes AI as a five-layer stack: energy, chips, infrastructure, models, and applications. This paper uses four categories because it folds chips and the data-centre infrastructure that houses them into a single “compute infrastructure” layer - spending on Nvidia GPUs and the buildings, networking, and cooling around them moves together and faces the same demand. Energy is treated separately (4.2) because it has its own supply constraints and price dynamics, as are model R&D (4.3) and applications (4.4). Spending on chips is the largest single component of 4.1, not a missing category.
To begin with, a chart showing spending in the last few years across these categories is presented below. The spending categories are not perfectly standardised across sources. IDC’s AI infrastructure series is used for compute infrastructure, while Menlo Ventures’ enterprise generative-AI breakdown is used as the best public proxy for frontier-model and application-layer spending. Energy infrastructure does not have a directly comparable verified public spend series in the sources reviewed, so it is left blank pending a better source. (Given the scale differences, the bar chart looks very skewed.)
| Category | 2023 | 2024 | 2025 | 2026 | Source note |
|---|---|---|---|---|---|
| Compute infrastructure | 0* | $153bn | $318 bn | $334 bn | IDC37 AI infrastructure spending; 2024 and 2025 are full-year actuals, 2026 is a reported projection. |
| Energy infrastructure | - | - | - | - | No verifiable category-specific series found. |
| Frontier model R&D | $2.3 bn | $9.2 bn | $18.0 bn | - | Menlo Ventures38 infrastructure-layer spending proxy; this is the closest public proxy for frontier-model and model-API spend. |
| Applications | $0.6 bn | $4.6 bn | $19.0 bn | - | Menlo Ventures39 application-layer spending. |
Table 1: AI spending across the 4 categories
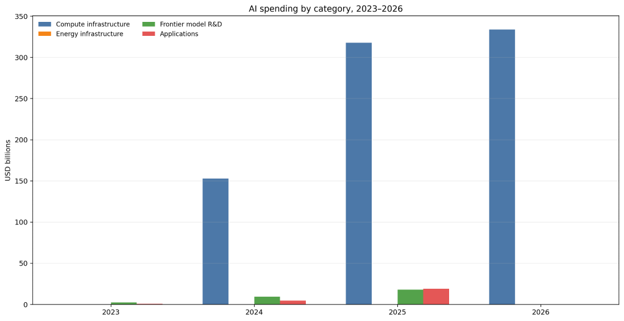
Figure 1: AI spending across the 4 categories
4.1 Compute Infrastructure
Two distinct workload types drive different parts of demand, and conflating them produces a misleading picture of both the current state and the risk profile of the investment.
Training compute is used to build models - the large, concentrated, compute-intensive jobs that run for weeks or months in large centralised facilities and produce a trained model as their output. Training compute demand has been the primary driver of the investment cycle to date, and it is training infrastructure that most data centre announcements and headline capex figures describe. As scaling returns diminish - or as algorithmic efficiency improvements reduce the compute required for a given capability level - training compute demand growth could moderate even as overall AI activity increases.
The DeepSeek developments of early 2025 provided a concrete example, when frontier-adjacent capability was achieved at dramatically lower training cost. This briefly erased hundreds of billions of dollars in market value from Nvidia, before the consensus developed that lower training costs would simply increase the number of training runs, sustaining aggregate demand.
Inference compute is used to run trained models - serving responses to user queries, processing documents, running agent loops. Inference demand scales directly with AI adoption and usage, not with lab-level investment decisions. Bain & Company projects inference data centre capacity growing from 2 gigawatts in 2024 to 54 gigawatts by 203040 - a trajectory driven by unmet demand. Inference is, by some measures, currently supply-constrained rather than demand-constrained, which is the opposite of the training situation. Deloitte’s 2026 technology predictions41 project inference workloads reaching roughly two-thirds of all AI compute by 2026, and by 2030 approximately 70% of all data centre demand is projected to come from AI inferencing. As diffusion picks up - as more enterprises and individuals use AI tools for tasks - inference demand will grow proportionally, and may sustain overall compute demand even if training growth decelerates.
IDC projects42 that global AI infrastructure spending will surpass $1 trillion annually by 2029, growing at a five-year CAGR of approximately 31% from 2025. The data centre server market is projected to grow from $204 billion in 2024 to $987 billion by 2030. The Stargate initiative commits $500 billion to US AI infrastructure over four years, with $100 billion deployed in 2025 alone43.
The efficiency risk embedded in these projections is underappreciated. Compute infrastructure demand is a function of two variables moving in opposite directions: AI workload growth increases demand, while computational efficiency improvement reduces required hardware per workload. Efficiency improvements typically reduce hardware requirements even as workloads grow. DeepSeek’s models, released in early 2025, demonstrated these capabilities. If algorithmic efficiency improvements continue at that pace, the upper-bound projections for infrastructure demand may prove significantly overstated.
There is also a specific risk from concentration. Nvidia commands approximately 80-90% of the high-end AI training chip market44. But AMD is mounting a credible challenge, Google’s TPUs continue to improve, and several hyperscalers are developing custom silicon that reduces their dependence on merchant chips. The circular financing arrangements described in Section 1 mean that a portion of Nvidia’s revenue is currently self-funded through investments in its own customers. Any unwinding of those arrangements - and there are early signs this is already happening45, with Nvidia reported to have scaled its OpenAI commitment back from $100 billion to $30 billion - would have revenue implications beyond what simple market forecasts currently reflect.
4.2 Energy Infrastructure
Bain & Company estimates46 that AI-specific compute demand is growing at roughly twice the rate of even the already-elevated recent trajectory. More concretely, data centres are projected to consume 9% of US electricity by 2030, up from roughly 2% in 202047. The US grid as a whole saw essentially flat load growth across the prior two decades. By 2030, global incremental AI compute requirements could reach 200 gigawatts, with the US accounting for half of that.
This has pushed major AI companies into direct investments in power generation: captive natural gas plants, commitments to restart mothballed nuclear facilities, and early-stage investments in small modular reactors and fusion research. These are very long-duration bets. The lead time from financing decision to operational power generation is 5-10 years for nuclear; it is 3-5 years even for gas. Most of the energy capacity needed for 2030 AI infrastructure therefore needs to be committed to construction within the next 18-24 months. If the AI investment cycle decelerates sharply before these energy projects are completed, they become stranded assets of a different kind. A data-centre can take new tenants or workloads, and its power draw falls when it sits idle. Dedicated generation built for one site — a captive gas plant or a restarted reactor — is committed years earlier, sized to a specific load, and tied to a specific grid connection. If that load does not arrive, the generation cannot easily be moved or resized to serve demand elsewhere, which is why it is harder to repurpose than the data centre it was meant to power.
The environmental dimension of this energy buildout is not the focus of this paper, but it deserves acknowledgment as a policy risk factor. AI companies have made net-zero commitments that are increasingly difficult to reconcile with their actual energy trajectories. If regulatory pressure around energy consumption intensifies - particularly in jurisdictions where electricity grids are already constrained - it represents an additional cost and potential constraint on the investment cycle that current projections do not adequately price.
4.3 Frontier Model R&D
OpenAI’s R&D spending reached approximately $6.7 billion in the first half of 2025 alone, according to The Information’s reporting48 on shareholder disclosures. This includes training costs, talent acquisition costs, and sales and marketing spending of $2 billion in that same six-month period.
The economics of frontier model development have a structural problem that no amount of scaling solves: the goods produced are non-rival and only partially excludable. A trained model can be replicated and deployed at near-zero marginal cost. Open-source models have shown that near-frontier capabilities can be offered at zero marginal cost to users - compressing the price premium closed-model providers can charge. Open-weight models from multiple developers - including releases from Kimi, DeepSeek, and others - have consistently demonstrated capabilities within roughly six months of the frontier, at dramatically lower inference cost to deployers.
Meta’s approach to open-source releases has evolved over time and may continue to do so; the more durable point is that the open-model ecosystem as a whole creates a floor on how much closed-model providers can charge for a given capability level. OpenAI and Anthropic are in the position of companies that must continue spending to stay at the capability frontier - but the frontier, once established, is being commoditised from below at a pace that compresses the revenue premium available to the leaders.
The inference cost problem compounds this. Unlike traditional SaaS, AI applications have significant ongoing inference costs - though these have fallen49 dramatically, by a factor of roughly 1,000 between 2022 and 2025. The primary driver of this reduction is algorithmic efficiency improvement - better model architectures, quantisation techniques, inference optimisation, and speculative decoding - rather than competitive pricing pressure alone. Research published at NeurIPS50 found that algorithmic progress is the dominant factor in LLM cost reduction, with hardware improvements and market competition playing secondary roles. Epoch AI’s tracking of inference prices51 found the price to achieve GPT-4 level performance on PhD-level science questions fell by 40x per year, with the fastest declines occurring from 2024 onwards.
LLMflation: When a Technology Gets Cheaper Faster Than Anyone Planned For
Anderson Horowitz coined the term “LLMflation” in late 2024 to describe the deflationary effect of rapidly-falling inference costs on the AI industry’s revenue projections. The numbers are striking: what cost $60 per million tokens in 2021 costs approximately $0.06 today52 - a 1,000-fold reduction in roughly four years. Epoch AI’s tracking53 of inference prices for a fixed level of model performance found rates of decline ranging from 9x to 900x per year, with the fastest drops occurring after January 2024.
This has an uncomfortable implication. In traditional SaaS, cost reductions in the underlying infrastructure flow through to improved margins - the software gets cheaper to build and the provider keeps the difference. In AI inference, the efficiency gains are visible to buyers and reflected in market pricing, because open-source models provide a reference point for what a given capability should cost. Providers can charge a premium above the open-source floor, but that floor drops continuously. Efficiency and competition are both keeping prices low, simultaneously. This is good for AI users and for the long-term diffusion of AI. It is harder to reconcile with the revenue projections that underpin current AI company valuations.
This has a dual effect on foundation lab economics. On the cost side, efficiency improvements reduce what labs spend to serve each query - which helps. On the revenue side, the same improvements set a market price ceiling. If a capable open-source model can produce equivalent outputs at far lower cost, the price a closed-model provider can charge for inference services is capped by that ceiling regardless of the quality premium of the frontier model. The unit economics improve as costs fall, but the revenue per unit falls at least as fast because the efficiency gains are visible to buyers and reflected in competitive pricing. This creates a less favourable long-run dynamic than the provider-side narrative implies: the technology is getting cheaper faster than it is getting more monetisable.
4.4 Applications
This is where value creation is most clearly demonstrable. Enterprise AI spending reached $37 billion in 2025, up from $11.5 billion in 202454 - a roughly threefold increase in one year. More than half of enterprise AI spend went to applications rather than infrastructure, indicating that enterprises are prioritising near-term productivity gains over long-run infrastructure bets. This is exactly the pattern Carlota Perez describes as the transition from installation to deployment: the excitement shifts from building infrastructure to building the application layer on top of it.
The productivity evidence at the firm level is measurable in specific contexts, even if the macro-level aggregate has not yet moved. Brynjolfsson, Rock, and Syverson’s NBER working paper anticipated this pattern explicitly: general-purpose technologies require significant complementary investments in organisational restructuring, new workflows, and new skills before their productivity benefits show up in statistics. The electrification of American factories in the early 20th century took roughly 30 years (after the first electric motors became available) before reflecting in productivity statistics. The entire factory floor had to be redesigned around the new technology. AI is likely following a similar diffusion path, though potentially faster.
The application layer is also the most pertinent for India. India’s AI investment has been concentrated almost entirely at the application layer - process automation, public sector deployment, domestic enterprise software. This means India is not substantially exposed to the capital cycle risks of the foundation model and infrastructure layer. Its risk is different and in some ways more consequential in the long run: in a scenario where the current investment wave consolidates the global AI ecosystem around two or three large Western (and Chinese) providers, India may find itself permanently dependent on imported AI infrastructure and models with limited ability to shape the terms of that dependency. Section 9 takes up India’s position and the policy choices that follow from it.
5. A Different Kind of Bubble
The current AI cycle shows classic bubble features: circular financing, valuations based on revenues that don’t yet exist, and the herd dynamics Shiller identifies in past speculative periods. But it also has features that are not typical of bubbles: demonstrated utility in high-value areas, measurable enterprise adoption, foundation model capabilities that have advanced in big steps, and major investors funding AI from profitable businesses instead of borrowed money. These features exist together in an unusual mix. Both the bubble-like and non-bubble-like features are coexisting, and focusing on only one side can lead to the wrong conclusions.
The Kindleberger-Minsky55 five-stage (displacement, boom, euphoria, distress, revulsion) model describes a process in which an opportunity causes a displacement that the underlying reality cannot support. The displacement is clearly present, since generative AI represents a capability discontinuity. The boom is clearly present - capital is flowing at extraordinary rates. Whether we are in euphoria, or have already entered financial distress, is an open question.
We face two structurally different decision problems simultaneously, and both produce the same behavioural outcome: investing heavily in AI regardless of near-term return calculations. These two decision problems are best illustrated through two distinct analytical lenses.
5.1 Matrix 1: The Investment Decision Under Uncertainty - A Prisoner’s Dilemma
The first framework is a Prisoner’s Dilemma. The axes represent strategic choices: invest heavily in AI, or do not. The columns represent what a competitor does; the rows represent what you do. The critical insight from this matrix is that “invest” is the dominant strategy regardless of what any individual competitor does - meaning rational actors will collectively overinvest even if they privately suspect overinvestment is occurring.
| Competitor Invests | Competitor Does Not Invest | |
|---|---|---|
| You Invest | (2, 2) Competitive parity: both commit capital, neither wins decisively; shared losses absorbed by operating businesses | (4, 1) Strong win: first-mover advantage in multi-trillion dollar software market; platform dominance |
| You Do Not Invest | (1, 4) Catastrophic loss: competitor achieves decisive capability advantage; platform obsolescence over 5-10 years | (3, 3) Small win: capital preserved, short-term efficiency; but strategically irrelevant in long run |
Table 2: Matrix 1: The Investment Decision Under Uncertainty - A Prisoner’s Dilemma
What the axes mean: The columns represent the competitor’s strategic choice (invest heavily in AI or not). The rows represent your choice. The quadrant values describe what happens to your company in each combination. The bottom-left cell (you don’t invest, competitor does) is the worst possible outcome because it implies both financial loss and strategic irreversibility. That asymmetry means every rational actor chooses to invest regardless of what they believe competitors will do. The Nash equilibrium - where no player can benefit by changing strategy unilaterally - locks the system into mutual heavy investment even if all players privately recognise the collective outcome is inefficient. This is the game-theoretic explanation for why industry executives like Sam Altman can simultaneously acknowledge that the investment cycle may be overheated and continue investing more aggressively. Both statements are rational.
The payoffs are to be read as follows: whatever the competitor does, “invest” scores higher for you than “do not invest” (2 beats 1 if they invest; 4 beats 3 if they do not). “Invest, invest” is therefore the Nash equilibrium - the (2, 2) cell. Even though both players would prefer the (3, 3) outcome, they cannot reach this without trusting each other not to defect.
The Prisoner’s Dilemma framing is an approximation, not a precise model. In the classic Prisoner’s Dilemma, the choices of the two players are independent - what prisoner A does will not change what options are available to prisoner B. In the AI investment case, the choices are entangled. If a competitor invests heavily and achieves a meaningful capability lead, your own investment options narrow - the talent pool tightens, the supply chain constraints worsen, and the cost of closing the gap rises. The axes are correlated, which means the payoff structure is more complex than the 2x2 matrix represents.
If scaling returns diminish, the investment logic embedded in Matrix 1 partially breaks down. The payoff for “invest heavily” changes if more investment produces less incremental capability than the model assumes. This is one of the reasons Matrix 2 - which explicitly models capability uncertainty - is necessary to complete the picture. The deeper point from this matrix is that the current investment surge does not require irrational actors to sustain it.
5.2 Matrix 2: The Technology-Revenue Outcomes Framework
The second framework captures the uncertainty about where this cycle ends. The axes are: (1) whether AI capabilities continue to advance substantially, and (2) whether enterprise revenue materialises fast enough to justify the investment.
| Revenue Materialises | Revenue Disappoints | |
|---|---|---|
| Capabilities Advance | [I] Continued Acceleration: justified investment; strong foundation lab survival; infrastructure vindicated | [II] Technology Without Business Model: capabilities advance but monetisation fails; “dark compute” scenario; second-wave beneficiaries win |
| Capabilities Plateau | [III] Plateau + Adequate Revenue: Leaner Stable Industry: models plateau but specific use cases (coding, CS, content) sustain leaner industry; 2-3 lab survivors | [IV] Hard Correction: plateau + revenue miss + macro shock; multiple lab failures; 2-4 year winter; infrastructure outlasts the investors |
Table 3: Matrix 2: The Technology-Revenue Outcomes Framework
What the axes mean: The rows represents AI capability trajectory - whether models continue to improve substantially or plateau near current levels. The columns represents the revenue outcome - whether enterprise adoption accelerates fast enough to generate the revenue the investment requires. These two variables are uncertain, consequential, and relatively independent: you can have capability advance without proportionate revenue (if AI creates diffuse value that cannot be appropriated by specific companies), and you can have modest capability advance alongside stable revenue (if current capabilities are already good enough for defined use cases).
Of the four, Quadrant IV (Hard Correction - capabilities plateau and revenue disappoints) is closest to the classic bubble outcome: the bet was wrong on both axes and the correction is sharp. Quadrant II (Technology Without Business Model) is a softer version - the technology is fine, but the specific firms that funded it do not capture the value, so investors still lose even though the bubble label fits poorly. The paper’s “productive bubble” claim lives mostly in Quadrants II and IV: the money is lost, the infrastructure is not.
The matrix also has an important implication that is easy to miss. The four quadrants are not equally likely, and they are not equally reversible.
- Quadrant I (Continued Acceleration) is already priced into current valuations, which means the upside for investors who believe in it is limited - the market has already paid for that outcome.
- Quadrant IV (Hard Correction) requires no single dramatic failure. A capability plateau combined with slower-than-projected enterprise revenue growth, arriving at the same time as a routine macroeconomic tightening, is enough to produce it.
- Quadrants II (Technology Without Business Model) and III (Plateau + Adequate Revenue) are the scenarios that bubble analysis could undervalue - the possibility that the technology proves valuable but the specific companies that funded it do not capture that value (Quadrant II), or that a leaner, consolidated industry settles into durable profitability on a narrower base than the investment cycle assumed (Quadrant III).
The matrix makes it clear that whether “AI succeeds” and “the current financial bets pay off” are different questions, which should not be conflated.
6. The Diffusion Variable
There is a third variable of diffusion that mediates between capability and revenue. Arvind Narayanan and Sayash Kapoor, in their paper “AI as Normal Technology”56, make the point that AI methods, AI applications, and AI adoption are three distinct phenomena that occur at different timescales. Methods improve quickly - often faster than headlines suggest. Applications develop more slowly, because useful applications require integrating capabilities into specific workflows with real-world constraints. Adoption happens most slowly of all, because it is gated by societal factors that have nothing to do with the technology itself: organisational learning curves, workforce readiness, regulatory environments, legacy system integration, liability concerns, and the trust that accumulates (or fails to accumulate) as deployment experience grows. Adoption happens at human speed.
Narayanan notes57 that there is a “capability-reliability gap” - AI systems can perform a task impressively in demonstration, but fail in ways that are unpredictable and difficult to manage in production. Closing that gap requires accumulated deployment experience and the organisational knowledge to deploy reliably, which takes time.
Deloitte’s 2026 AI trends analysis58 identifies the core barriers as: limited interoperability with existing legacy infrastructure, skills shortages in AI deployment and maintenance, unclear ROI measurement frameworks, and governance and compliance uncertainty. These are organisational and institutional problems that will resolve at institutional timescales, which are measured in years.
The implication for Matrix 2 is significant. A scenario in which capabilities plateau while revenue disappoints (Quadrant IV) is in fact only one of two scenarios in which near-term revenue fails to materialise as projected. Revenue can also disappoint in a world where capabilities are strong but diffusion is slow - Quadrant II, wherein capabilities advance quickly but the revenue level implied by these capabilities is delayed. In that scenario, the investment cycle might turn before the revenue materialises.
The most probable near-term risk is that AI proves useful on a timescale of years, which the current financing arrangements are not designed to wait for. Much of that investment is still funded from operating cash flows rather than debt, so it is not over-leveraged today; but hyperscaler capex is approaching the ceiling of operating cash flow (Section 2.2), and any move toward borrowing would shorten the time the cycle can run before a correction is forced. Incorporating diffusion speed as an explicit variable would add a third axis to Matrix 2 - and suggest a wider range of intermediate scenarios between the four quadrants presented.
7. Possible Outcomes: A Scenario Analysis
The four quadrants of Matrix 2 map onto distinct real-world scenarios with different consequences for different stakeholders. Rather than assign hard probability numbers to each, it is better to characterise what each scenario requires to materialise, and who bears what consequences in each case.
The four quadrants of Matrix 2 map onto four scenarios, each with a different distribution of consequences. The mapping is as follows: Soft Landing sits between Quadrants I and III; Hard Crash is Quadrant IV; Continued Acceleration is Quadrant I; Bifurcated Market is the mixed case spanning II and III.
Scenario 1: Soft Landing (Moderate Correction)
In this scenario, AI capabilities continue to advance, but at a slower pace than during the 2022-2025 period. Revenue growth accelerates sufficiently to justify substantial AI investment levels, albeit lower than the current ones. Valuation multiples reduce substantially across the board.
While painful for investors who entered at peak valuations, this is not an existential event for the technology or its ecosystem. Several mid-tier foundation model developers fail or are absorbed, and the field consolidates around a handful of credible global players rather than the current crowded field. Hyperscale companies absorb losses within their existing operating cash flows and continue steady, if reduced, investment. Enterprise adoption broadens into well-defined use cases where ROI is demonstrable.
Hardware vendors see revenue moderation rather than collapse: Nvidia’s growth slows from hyperbolic to merely strong, and hyperscalers reduce dependence on any single supplier. Enterprise customers benefit most clearly because prices stabilise, products mature, and the chaotic early-adopter environment gives way to something closer to a normal enterprise software market with defined vendors, SLAs, and procurement processes.
In this scenario, diffusion proceeds at a steady institutional pace (as one would normally expect), which is what lets revenue catch up without the cycle breaking.
The Denominator Problem: How Do You Evaluate an Investment With No Current Return?
In June 2024, Goldman Sachs published a note with a pointed question: “Gen AI: Too Much Spend, Too Little Benefit?”59 The note surveyed economists and technology investors on whether the returns from AI investment could justify the capital being deployed. The consensus response - from Daron Acemoglu among others - was that even the more modest AI use cases would take years to generate returns, and that a significant portion of current AI investment would not produce adequate returns at all.
The denominator in the return calculation keeps growing. The four major hyperscalers invested approximately $560 billion in AI infrastructure across 2024-2025 while generating roughly $35 billion in AI-specific revenue - about six cents of revenue for every dollar invested. Defenders of the investment argue that the denominator represents a multi-year bet on a multi-year return, not a current-year asset. The question is whether the return timeline is consistent with the financial structure. Infrastructure investments typically carry amortisation schedules of 10-15 years, which means the required return is being measured over a decade.
If AI-specific revenue reaches the $2 trillion annual level that Bain estimates is required to justify the buildout, the investment will have been well placed. If it reaches $500 billion - still extraordinary growth - the NPV is marginal.
Scenario 2: Hard Crash (Severe Correction)
This scenario requires a combination of factors that are individually very likely, but less likely in combination: model capabilities plateau near current levels, enterprise customers simultaneously reduce AI spending due to poor demonstrated ROI, and a macroeconomic shock - an interest rate reversal, a recession, a geopolitical disruption - triggers a broader shift in capital markets, withdrawing the liquidity sustaining the risky AI investment cycle. The Kindleberger-Minsky revulsion phase sets in, in which assets that were obviously valuable during the euphoria become obviously overpriced, capital markets close for loss-making technology companies, and the feedback loops that sustained the boom reverse, accelerating the bust.
The stakeholder consequences are severe and widely distributed. Multiple foundation labs fail. Nvidia’s stock price could decline sharply - potentially by a majority of its peak value - as chip demand falls when hyperscalers sharply reduce new orders (as they work through existing overcapacity). The hyperscaler companies themselves survive due to diversified revenue, but reduce AI investment sharply and refocus on extracting returns from infrastructure already built rather than expanding it. Enterprise customers who made large multi-year AI commitments face stranded assets. The startup ecosystem effectively freezes for several years.
The productive bubble insight matters most here: infrastructure and algorithmic innovations don’t disappear when the financial cycle collapses. They become available - often at cheap prices - to subsequent builders who did not bear the cost of constructing them. This is what Carlota Perez documents across prior technological revolutions: the railway mania of the 1840s destroyed most railway investors while leaving Britain a network that enabled a century of industrial growth.
It is pertinent to recognise that slow diffusion is part of the trigger - revenue does not arrive before credit tightens.
Scenario 3: Continued Acceleration (No Significant Correction)
This is the scenario that current AI company valuations could be largely pricing. The upside is already reflected in prices, leaving limited incremental returns if expectations are met and substantial downside if they are not. AI capabilities advance faster than expected, approaching or achieving meaningful breakthroughs in reasoning, planning, and autonomous operation. Enterprise revenue accelerates beyond current projections as AI demonstrates transformative rather than merely incremental value. The revenue thresholds that currently look like enormous stretch targets turn out to be achievable within the projected window. Current investment levels are vindicated or even prove insufficient.
Foundation labs become among the most valuable enterprises globally, and early investors capture huge returns. Nvidia and infrastructure providers see sustained demand growth that justifies the investment cycle. But this scenario almost certainly also triggers severe labour market disruption in domains where AI capabilities cross the threshold of reliable task completion: programming, customer service, legal research, financial analysis, and medical diagnostics are the first candidates. The disruption concentrates in the white-collar knowledge economy in ways that generate political and social pressures for regulatory responses that could, depending on their design, either accelerate or curtail the technology’s diffusion.
Even if capabilities advance dramatically, the ability of specific companies to capture that value as durable revenue depends on competitive dynamics. Open-source models, national government AI programmes, and rapidly declining inference costs could diffuse value broadly rather than allowing concentration.
At this point, it would be important to note that this scenario requires diffusion to move unusually fast, faster than the organisational-adoption record suggests is normal.
Scenario 4: Bifurcated Market (Split Outcomes)
In this scenario, rather than the ecosystem moving uniformly toward correction or continuation, different parts of the AI stack diverge. Some use cases and some players deliver extraordinary value while others fail.
The bifurcation operates along several dimensions simultaneously. At the use-case level, domains where AI has demonstrated the clearest productivity gains - software engineering, customer service, content generation, specific diagnostic tasks in healthcare and law - continue to attract investment and deliver returns. Applications oversold during the frenzy phase disappoint and see investment withdrawn. At the company level, two or three foundation labs capture the majority of value while the rest fail or are acquired, creating a more concentrated market than existed during the boom. At the enterprise level, a two-speed adoption pattern emerges between AI leaders - companies that invested in workflow redesign alongside tool acquisition - and AI laggards, who didn’t. In other words, diffusion is the splitting variable - fast adopters who redesign workflows pull ahead, slow adopters stall.
The scenarios above turn on the capability axis, and there are three views on where capability goes. The scaling optimists (the position behind continued investment at OpenAI, Anthropic, and Google DeepMind) expect more compute to keep producing better reasoning and autonomy. The scaling sceptics — Helen Toner’s 2024 Senate testimony60, HEC Paris researchers61, Yann LeCun62 - note that frontier benchmarks appear to have plateaued and argue that scaling alone will not reach the next level. A third view, Narayanan and Kapoor’s “AI as normal technology63”, holds that even if capability stalls, diffusion of what already exists produces large effects over decades, as electrification did. In this pathway, the relevant question is whether existing AI capabilities diffuse broadly enough to justify the current investment.
The electrification analogy Brynjolfsson uses is relevant here: the electric motor did not fundamentally change after roughly 1910, but its diffusion through American manufacturing - which required redesigning factory floors, retraining workers, and rebuilding supply chains - continued for 30 years and produced most of the productivity gains. Optimists point to Continued Acceleration; sceptics to the plateau scenarios; the diffusion view says the key question is adoption speed, not capability - which is the variable this section has traced through each scenario.
These two paths - continued capability advancement versus diffusion-led maturation of existing capabilities - have different implications for the financial structure of the AI industry. The first rewards the foundation labs and infrastructure providers disproportionately. The second rewards the application layer builders and the verticals that invest in workflow redesign. A third group gains under either path: the systems integrators and consultants that help organisations redesign workflows around AI, since diffusion runs through them whichever layer captures the value.
8. Causal Loop Analysis of the AI Investment Cycle
This section models the foregoing analysis of the bubble burst scenarios using causal loop diagrams.
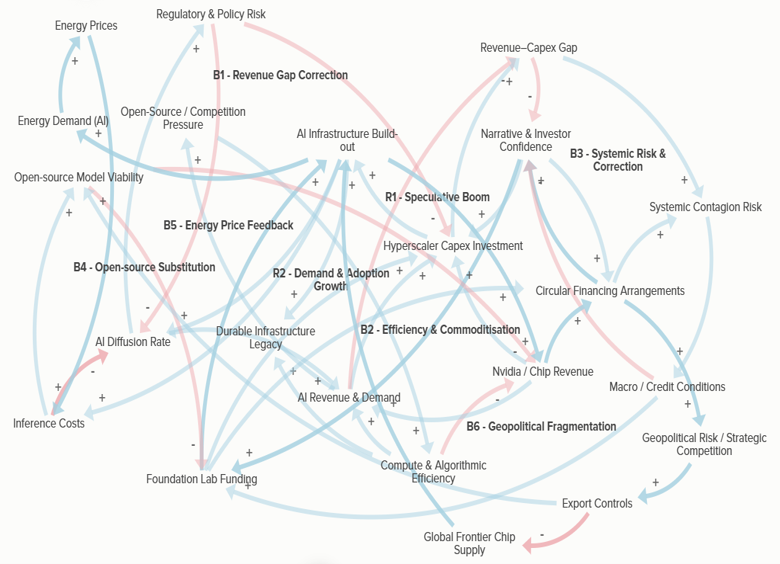 Figure 2: A causal loop diagram to aid the analysis of AI bubble burst scenarios
In a causal loop diagram, positive (+) notation on an arrow means the directionality of change for two connected elements is the same (if A increases, B increases and vice-versa), while negative (-) means the directionality of change is opposite (if A increases, B decreases and vice-versa).
A loop exists when two or more elements are connected in such a manner that no matter which element one starts from, following the arrows leads to an endless cycle. A reinforcing loop is one in which the number of negative connections is zero or even; a balancing loop is one in which the number of negative connections is an odd number.
The AI investment cycle is driven by two self-reinforcing loops operating simultaneously. The first, the Speculative Boom loop (R1 in Figure 2), runs from investor narrative through foundation lab funding, infrastructure build-out, chip revenue, and circular financing arrangements - and back to narrative again. Each node amplifies the next. The second, the Demand and Adoption loop (R2 in Figure 2), says that AI revenue justifies hyperscaler capex, which expands infrastructure, which lowers access costs, which drives broader adoption, which generates more revenue. Both loops push investment upward.
The gap between these two loops is where the system’s fragility lives. The two loops differ in what keeps them running. The speculative loop (R1) can keep going on investor confidence alone, even before revenue appears. The demand loop (R2) only closes when AI is actually adopted and used widely enough to produce revenue. When confidence runs ahead of adoption, R1 expands while R2 lags, and the distance between them is the system’s main weak point: if confidence breaks before adoption catches up, there is nothing underneath to hold the cycle up.
Six balancing loops work against the reinforcing ones, but they operate slowly.
The Revenue-Capex Gap loop (B1 in Figure 2) corrects when the distance between capital deployed and revenue earned becomes too visible to ignore - investor confidence cools, capex moderates, and revenue growth eventually closes the gap from the other side.
The Efficiency and Commoditisation loop (B2 in Figure 2) is more structural: falling inference costs expand the market, but simultaneously compress provider margins and reduce hardware demand per workload. More AI use does not automatically mean more revenue for the companies funding the buildout.
The Systemic Risk loop (B3 in Figure 2) is the most dangerous. If the revenue gap remains wide while credit conditions tighten, stress spreads quickly through interconnected financing arrangements and spills into broader capital markets. The corrective force here would not be gradual. A fourth balancing loop - Open-source Substitution loop - runs through the open-source model ecosystem (B4 in Figure 2). As inference costs fall - driven by the efficiency improvements already captured in B2 - open-source models become more viable alternatives to closed commercial models. This reduces provider margins through a different channel than B2 - not because operational costs fall, but because the competitive reference point falls.
This loop carries a second-order effect on R1: if open-weight models deliver near-frontier capability at low cost, the investment case for expensive closed-model development weakens, reducing the flow of capital into foundation lab funding and moderating the speculative boom. B4 therefore interacts with both B2 and R1 simultaneously.
B4 has a second effect that runs the other way. Cheap, capable open-weight models lower the cost of building on top of AI, which speeds diffusion (strengthening R2) and shifts investment downstream, away from training new frontier models and toward applications built on existing ones. So open source does two things at once: it compresses margins for closed-model providers, and it enlarges the application layer where adoption and revenue accumulate. The first effect cools the speculative loop; the second feeds the demand loop. For a country positioned at the application layer, the second effect is the more relevant one.
The fifth balancing loop - Energy Price Feedback loop - operates through electricity markets (B5 in Figure 2). As AI infrastructure expands, data centre electricity demand rises substantially. Rising demand, against grids with limited near-term supply-side response, puts upward pressure on wholesale and retail power prices. Higher energy costs raise the operational cost of running AI inference workloads. This feeds back through higher access costs, which slow adoption, reduce the AI revenue flowing into R2, and moderate the hyperscaler capital expenditure that drives infrastructure expansion.
- The B5 loop partially offsets B2’s cost reduction trajectory rather than reversing it: efficiency improvements continue to lower algorithmic costs, but energy costs act as a floor that rises with infrastructure scale. The loop is more binding in infrastructure-dense markets where grid constraints are already tightening ahead of near-term projected capacity additions.
The sixth balancing loop - Geopolitical Fragmentation loop - operates through institutional and political responses to AI capital concentration (B6 in Figure 2). As AI infrastructure investment concentrates in a small number of firms in two geographies, it generates regulatory responses that constrain the hardware the investment cycle depends on. The US export control rounds on advanced AI chips are the most direct current instance. Export controls reduce the global supply of frontier chips available to the investment cycle, which constrains the infrastructure build-out that sustains R1.
- Unlike B1, B2, B4, and B5, which are economic feedback loops that correct gradually, B6 operates at political and institutional speed - which means it can introduce sudden, large discontinuities rather than gradual corrections. It also carries a secondary branch: export controls push restricted parties toward national AI programme investment, which tends to increase open-source model development as a strategic hedge, feeding into the B4 loop.
The leverage points are the nodes where a change in behaviour produces disproportionate effects on the whole system. The AI Diffusion Rate is the most critical. Current AI capabilities are already sufficient for wide commercial deployment. The binding constraint on revenue is how quickly organisations can restructure workflows, retrain staff, and build institutional trust in AI outputs. Accelerating diffusion directly strengthens the R2 loop and the system’s ability to self-correct.
The Revenue-Capex Gap itself is a leverage point of a different kind as it is the system’s early warning signal. Transparent, consistent measurement of AI-specific revenue against total capital deployed provides the information that markets need to calibrate.
The Circular Financing Arrangements node is structurally important, because it manufactures demand signals that are not reflective of underlying facts. Reducing circular revenue — through disclosure requirements or accounting standards — would remove a source of false confidence from the R1 loop. Investment backed by independent end-demand would continue; investment resting only on manufactured demand signals would correctly not, which is part of the intended effect.
Two external variables bound the whole system.
- Macro and credit conditions do not emerge from within the AI cycle, but they determine how long the reinforcing loops can run before a correction is forced. A credit tightening arriving while the revenue gap is still large compresses the time available for diffusion to close it.
- The AI Infrastructure Build-out, while a driver of risk during the boom, also feeds the Durable Infrastructure Legacy node - the physical and algorithmic assets that persist beyond any financial correction. This is the productive bubble insight the paper advances. The policy and strategic implication should be about whether the infrastructure being built is an enabling one, and whether the diffusion rate can be accelerated enough for revenue to justify it before the cycle turns.
9. India’s Policy Position in the AI Investment Cycle
India sits in a specific position in the investment landscape this paper has described. Its AI investment has concentrated almost entirely at the application layer - process automation, public sector deployment, and domestic enterprise software. This means India is not substantially exposed to the capital cycle risks of the foundation model and infrastructure layer. The IndiaAI Mission is significant by Indian standards, but negligible relative to the $600 billion in annual hyperscaler capex committed for 2026 alone. India is not, and is not likely to become, a participant in the foundation model investment cycle at any meaningful scale.
This position is partly protective and partly a strategic problem. India is not likely to be exposed to the financial losses if the cycle corrects sharply. But in any consolidation scenario - Quadrant III or Quadrant IV in Matrix 2 - the surviving AI ecosystem is highly likely to be organised around two or three large (Western, and potentially Chinese) infrastructure providers, with India dependent on those providers for foundational AI capabilities. The terms of that dependency are not yet set.
Five policy directions follow from the analysis in this paper. These policy recommendations address the investment and business context primarily. They are not a full AI strategy for India - research and development priorities, talent, safety, and other aspects are out of scope of this paper. One observation follows before the specific measures. Much of the value at the diffusion stage accrues to the firms that integrate AI into workflows, and India’s IT services majors are well placed to supply that integration and workflow-redesign capacity, both domestically and as an export. This is an existing strength to build on, not a capability that has to be created.
9.1 Reorient the IndiaAI compute allocation toward inference infrastructure
The IndiaAI Mission’s compute component is currently oriented toward high-end GPU procurement for training workloads. The analysis in Section 4.1 shows this is the wrong priority. Training compute is where the major hyperscalers are already competing at a scale India cannot match, and where scaling returns may be diminishing. Inference compute is where deployment value lies, where demand is currently supply-constrained, and where a modest national investment can generate proportionate returns.
India should redirect its compute allocation toward inference clusters distributed across existing data centre hubs - Hyderabad, Mumbai, and Chennai, where fibre and power infrastructure already exists. The objective is not to compete in the training investment cycle. It is to become a credible inference deployment hub for Indian and regional workloads, with lower stranded asset risk than training infrastructure would carry in a correction scenario.
9.2 Fund open-source model adaptation rather than proprietary frontier development
The open-source substitution dynamic documented in Section 4.3 makes proprietary frontier model development a poor business investment for India at this stage of the cycle (though it might have good research diffusion effects). India’s tractable investment is in systematic adaptation of open-source base models: fine-tuning across the Indian languages, Indian legal and regulatory text, healthcare documentation, agricultural data, etc. The return per rupee from adaptation would substantially exceed the return from training proprietary foundation models, and the resulting capabilities will most likely not depend on any single foreign provider’s continued operation or commercial terms. In a Hard Correction scenario (Quadrant IV), open-source adapted models remain available regardless of which foundation labs survive.
9.3 Extend a modified digital public infrastructure model to AI integration
The diffusion constraint for India is mostly institutional: legacy systems, unclear liability, and weak procurement standards slow adoption across government and regulated sectors. UPI solved a similar coordination problem in payments by standardising authentication and settlement centrally, so that private firms could build on a common rail without each re-solving the basics.
The same idea applies to AI in public services - but as a thin layer, not a provider. The government’s role is to set standards: common APIs for AI-assisted public services, audit-trail and logging requirements, model-output portability formats, and clear liability allocation for automated decisions. The models and applications themselves stay with private and open-source providers.
This is explicitly not a proposal to build a state-owned AI company or a public-sector model. The failure mode to avoid is exactly that - a new PSU that crowds out the private sector and locks the state into a single in-house provider. The value is in the standards and the interoperability they create, which is cheap to provide and hard for the private market to coordinate on its own. Extending the approach already validated in payments, identity, and commerce to the AI deployment layer could work.
9.4 Build scenario-contingent terms into government AI procurement contracts
As the Matrix 2 analysis shows, which scenario materialises will determine which vendors survive. India’s current government AI procurement is largely ad hoc, creating the risk of concentration in vendors that may not exist in their current form five years from now. In Quadrant III (consolidation) and Quadrant IV (hard correction), several current AI vendors will most likely fail or be absorbed, and contracts that do not address this create switching costs that compound over time.
Three specific requirements can reduce this risk at relatively low contractual cost: data and model output portability in open formats, so that switching costs do not lock procurement into any single vendor; multi-vendor requirements for deployments above a defined threshold scale; and open-source fallback provisions for services classified as critical government infrastructure. Instituting these requirements does not require predicting which scenario materialises.
9.5 Formalise participation in open-source governance and AI standards bodies
The geopolitical fragmentation loop (B6 in Section 8) shows that the scale of the AI investment boom is already generating institutional responses - export controls, domestic chip programmes, competing national AI strategies - that are fragmenting the global AI stack. India’s position in that fragmentation is uncertain: it is neither a US treaty ally with full frontier chip access, nor do we have a protected domestic market. Open-source AI governance is currently the one multilateral space in the AI landscape where India can participate without capital requirements. ISO/IEC JTC 1/SC 42 - the primary international AI standards body, active since 201764 - and Linux Foundation AI & Data (LF AI & Data) are venues where Indian technical participation carries immediate policy influence. Bilaterally, the US-India Initiative on Critical and Emerging Technologies (iCET), formalised at the June 2023 White House summit, covers semiconductors and AI cooperation and provides a framework for chip access that does not depend on the broader bilateral relationship being frictionless at all times65. India should engage these channels as a primary strategic priority, not as a secondary one.
10. Conclusion
The investment in the AI industry is happening at an exceptional scale. Circular financing and the revenue gap are both facts. Capabilities have advanced in large steps, enterprise adoption is happening, and productivity gains in specific areas are documented. Both the bubble-like features and the underlying utility are present simultaneously, and focusing on only one side produces the wrong conclusions.
The infrastructure and capabilities being built are most likely to outlast the financial cycle that is funding them. This has been the pattern in every prior technological revolution, as Carlota Perez documents. What we cannot know is when the cycle will turn, or which companies will be present when it does. The answer depends primarily on how quickly AI diffuses through organisations and sectors - an institutional process that takes longer than current financial structures are designed to wait for.
Three leverage points emerge from the causal analysis with direct relevance for policy. The diffusion rate is the most consequential: accelerating the adoption of existing AI capabilities through integration infrastructure, workflow redesign support, and liability clarity is the variable that most determines whether current investment is vindicated before the cycle turns. The transparency of the revenue-capex gap matters because markets cannot correct what they cannot measure - consistent, comparable reporting of AI-specific revenue against total capital deployed would improve the information on which investment decisions are made. And reducing circular financing arrangements removes a source of manufactured demand signals from the investment cycle; investment backed by independent demand would continue, while investment resting on those signals would not.
For India, the productive bubble framing has a direct implication. India is not exposed to the financial losses of a sharp correction, but it is exposed to the strategic risk of a consolidated AI ecosystem in which it has no foundational capability and no hand in setting the terms. The five recommendations in Section 9 - on compute reorientation, open-source adaptation, digital infrastructure extension, procurement standards, and standards body participation - address that risk within India’s actual policy capacity and without requiring India to compete at a capital scale that is not available to it.
Footnotes
Robert J. Shiller, Irrational Exuberance, 3rd ed. (Princeton, NJ: Princeton University Press, 2015).↩︎
Jordan Novet, “Microsoft Expects to Spend $80 Billion on AI-Enabled Data Centers in Fiscal 2025,” CNBC, January 3, 2025, Link.↩︎
“Nvidia’s $100 Billion OpenAI Commitment Raises Circular-Financing and AI-Bubble Concerns,” Fortune, September 28, 2025, Link.↩︎
“The Circular Economy of AI,” The Register, November 4, 2025, Link.↩︎
“The AI Ouroboros,” The American Prospect, October 15, 2025, Link.↩︎
JPMorgan Asset Management. “Is AI Already Driving U.S. Growth?” September 12, 2025, Link.↩︎
International Data Corporation, “AI Infrastructure Spending Caps a Historic Year at $90 Billion in Q4 2025; 2029 Spending to Eclipse $1 Trillion,” IDC Blog, 2026, Link.↩︎
CreditSights, “Technology: Hyperscaler Capex 2026 Estimates,” CreditSights, 2025, Link.↩︎
Goldman Sachs, “Why AI Companies May Invest More Than $500 Billion in 2026,” Goldman Sachs Insights, 2025, Link.↩︎
“OpenAI’s Internal Financials Project $74 Billion in 2028 Losses and Profitability by 2030,” Fortune, November 12, 2025, Link.↩︎
CreditSights, “Hyperscaler Capex 2026 Estimates.”↩︎
Reuters, “No Firm Is Immune if AI Bubble Bursts, Google CEO Tells BBC,” November 18, 2025, Link.↩︎
“Google Chief Warns of ‘Irrational’ Surges as AI Investment Boom Stirs Bubble Fears,” Computing, 2025, Link.↩︎
“Google Chief Warns of ‘Irrational’ Surges,” Computing.↩︎
“OpenAI CFO Would Support a Federal Backstop for Chip Investments,” Wall Street Journal, video, November 2025, Link.↩︎
“Sam Altman Says He Doesn’t Want the Government to Bail Out OpenAI if It Fails,” TechCrunch, November 6, 2025, Link.↩︎
“Sam Altman on Bailouts,” TechCrunch.↩︎
Gartner, “Latest Hype Cycle for Artificial Intelligence Goes Beyond GenAI,” Gartner, 2025, Link.↩︎
“Dot-Com Bubble,” EBSCO Research Starters: Economics, Link.↩︎
Shiller, Irrational Exuberance.↩︎
Carlota Perez, Technological Revolutions and Financial Capital: The Dynamics of Bubbles and Golden Ages (Cheltenham: Edward Elgar, 2002).↩︎
Shawn Tully, “Everyone’s Wondering If, and When, the AI Bubble Will Pop. Here’s What Went Down 25 Years Ago That Ultimately Burst the Dot-Com Boom,” Fortune, September 27, 2025, Link.↩︎
“AI Training vs. Inference: How Do They Impact Cooling?” AirSys North America, 2025, Link. (reporting inference-capacity projections from Bain & Company).↩︎
Deloitte, “TMT Predictions 2026: AI and the Coming Surge in Compute Power,” Deloitte Insights, 2025, Link.↩︎
“NVIDIA and the Cautionary Tale of Cisco Systems,” Harding Loevner, September 2025, Link.↩︎
McKinsey & Company, “The State of AI,” McKinsey, 2025, Link.↩︎
Erik Brynjolfsson, Daniel Rock, and Chad Syverson, Artificial Intelligence and the Modern Productivity Paradox: A Clash of Expectations and Statistics, NBER Working Paper No. 24001 (Cambridge, MA: National Bureau of Economic Research, 2017), Link.↩︎
“Railway Mania: The Largest Speculative Bubble You’ve Never Heard Of,” FocusEconomics, 2025, Link.↩︎
“Managerial Failure in Early Victorian Britain: Network and Capital Expansion during the Railway Mania,” Business History (2022), Link.↩︎
“Banking Panics of the Gilded Age,” Federal Reserve History, Federal Reserve Bank of Richmond, Link.↩︎
“Panic of 1873,” This Month in Business History, Library of Congress, Link.↩︎
Finance and Economics Discussion Series 2002-11 (Washington, DC: Board of Governors of the Federal Reserve System, 2002), Link.↩︎
“Andrew Carnegie: Man of Steel,” Inside Adams (blog), Library of Congress, December 2012, Link.↩︎
IDC, “AI Infrastructure Spending.”↩︎
Menlo Ventures, “2025: The State of Generative AI in the Enterprise,” Menlo Ventures, 2025, Link.↩︎
Menlo Ventures, “State of Generative AI in the Enterprise.”↩︎
“AI Training vs. Inference,” AirSys North America.↩︎
Deloitte, “TMT Predictions 2026: Compute Power.”↩︎
IDC, “AI Infrastructure Spending.”↩︎
“Announcing the Stargate Project,” OpenAI, January 21, 2025, Link.↩︎
“Nvidia AI Chips Face Rising Competition,” InsiderFinance, January 2026, Link.↩︎
“Nvidia CEO Huang Says $30 Billion OpenAI Investment ‘Might Be the Last,’” CNBC, March 4, 2026, Link.↩︎
Bain & Company, 2025 Global Technology Report.↩︎
U.S. Department of Energy, Office of Electricity, “Clean Energy Resources to Meet Data Center Electricity Demand,” 2024, Link., citing Electric Power Research Institute, Powering Intelligence: Analyzing Artificial Intelligence and Data Center Energy Consumption (2024).↩︎
“OpenAI’s First-Half Results: $4.3 Billion in Sales, $2.5 Billion in Cash Burn,” The Information, 2025, Link.↩︎
Guido Appenzeller, “LLMflation: LLM Inference Cost Is Going Down Fast,” Andreessen Horowitz, 2024, Link.↩︎
“The Price of Progress: Price Performance and the Future of AI”, arXiv:2511.23455, Link.↩︎
Epoch AI, “LLM Inference Price Trends,” Epoch AI Data Insights, Link.↩︎
Appenzeller, “LLMflation.”↩︎
Epoch AI, “LLM Inference Price Trends.”↩︎
Menlo Ventures, “2025: The State of Generative AI in the Enterprise,” Menlo Ventures, 2025, Link.↩︎
Charles P. Kindleberger and Robert Z. Aliber, Manias, Panics, and Crashes: A History of Financial Crises, 7th ed. (Basingstoke: Palgrave Macmillan, 2015).↩︎
Arvind Narayanan and Sayash Kapoor, “AI as Normal Technology,” Knight First Amendment Institute at Columbia University, April 2025, Link.↩︎
Arvind Narayanan, “AI as Normal Technology” (paper presented at the World Bank Annual Bank Conference on Development Economics [ABCDE], 2025), Link.↩︎
Deloitte, “AI Adoption Challenges: 2026 AI Trends,” Deloitte, 2025, Link.↩︎
Goldman Sachs, “Gen AI: Too Much Spend, Too Little Benefit?” Top of Mind, June 25, 2024, Link.↩︎
Helen Toner, testimony before the U.S. Senate Committee on the Judiciary, Subcommittee on Privacy, Technology, and the Law, September 17, 2024, Link.↩︎
HEC Paris, “AI Beyond the Scaling Laws,” November 30, 2025, Link.↩︎
“AI Beyond the Scaling Laws,” HEC Paris.↩︎
Narayanan and Kapoor, “AI as Normal Technology.”↩︎
“ISO/IEC JTC 1/SC 42: Artificial Intelligence,” International Organization for Standardization, Link.↩︎
“Joint Fact Sheet: The United States and India Continue to Chart an Ambitious Course for the Initiative on Critical and Emerging Technology,” The White House, June 17, 2024, Link. (Note: iCET was launched in January 2023; see also U.S.–India joint statement, June 2023.)↩︎