India’s Agricultural Trade: Policies and Prospects
| AUTHOR | Anisree Suresh |
| DATE | August 26, 2025 |
| DOCUMENT | Takshashila Report 2025-16. |
| VERSION | Version 1.0, August 2025. |
| CATEGORIES | Geoeconomics Public Policy |
Executive Summary
Since independence, India’s agricultural trade policies have been focused on protection. High tariffs, government price guarantees, and export bans have been frequently introduced to cushion farmers from price variations. But this shield has come at a cost. Export bans—such as those on wheat and non-basmati rice—send confusing signals to global markets, reducing trust in India as a dependable supplier.
Consumers, too, bear the brunt. Import tariffs, among the highest in the G20, make everyday items, from edible oils to dairy, more expensive than the global market. The result is a paradox: farmers are not always getting better prices, consumers are paying more, and India loses bargaining power in trade deals. While India has signed over a dozen trade agreements, it systematically shields agriculture through exclusion lists and modest Tariff Rate Quotas (TRQs).
There is a middle path. Liberalising carefully chosen sectors—like edible oils and nuts—could lower costs for consumers without threatening farmers. At the same time, India can leverage its strengths in rice, shrimp, and spices to secure better access in high-value markets abroad. This would mean moving from a defensive posture to one that uses India’s agricultural power as a bargaining chip.
Introduction
India’s agricultural sector constitutes around 18-19 per cent of the GDP, providing livelihood support to approximately 42.3 per cent of the Indian population as of 2024 1. Historically, the agricultural trade policy in India was predominantly prioritised to ensure food security and self-sufficiency for its growing population. Consequently, agricultural trade was subjected to various Quantitative Restrictions (QR), import and export bans, and higher tariff rates for agricultural imports. Particularly since the 1960s, various policies were introduced by India—such as minimum support prices and input subsidies—at the cost of trade distortion to support domestic production and price stabilisation. While the economic liberalisation of 1991 pushed the other sectors to open up for foreign competition, the liberalisation in agriculture only gained momentum post the implementation of the 1994 WTO Uruguay Round Agreement on Agriculture (AoA). However, despite the liberalisation efforts, India continues to employ a mix of domestic protectionist measures, export controls and higher import tariffs.
This paper examines India’s agricultural trade landscape within this complex policy and global context. It examines India’s agricultural trade policies and their impact on its global trade and market competitiveness. It argues that domestic policy dynamics, which aim to balance farmer welfare, food security, and price stability, often create constraints and conflicts that impact India’s agricultural trade potential and competitiveness on the global stage. Understanding these intertwined domestic and international factors is crucial for assessing India’s current trade status, and identifying potential pathways.
India’s Agricultural Trade Overview
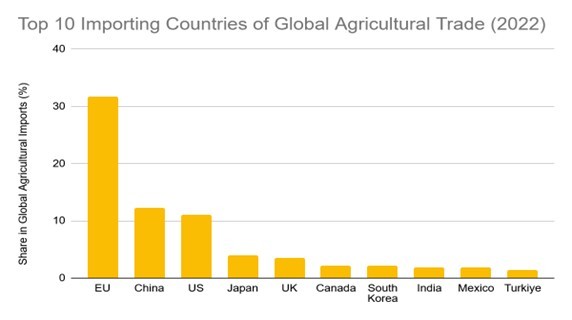
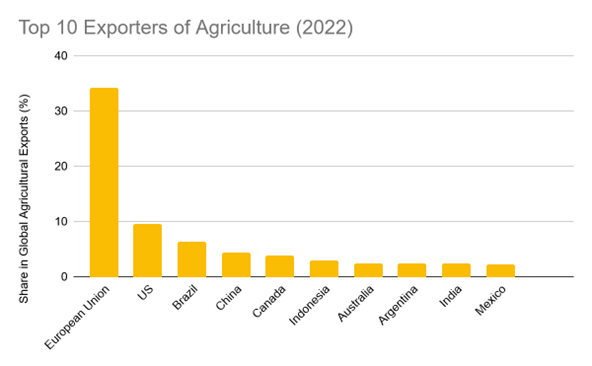
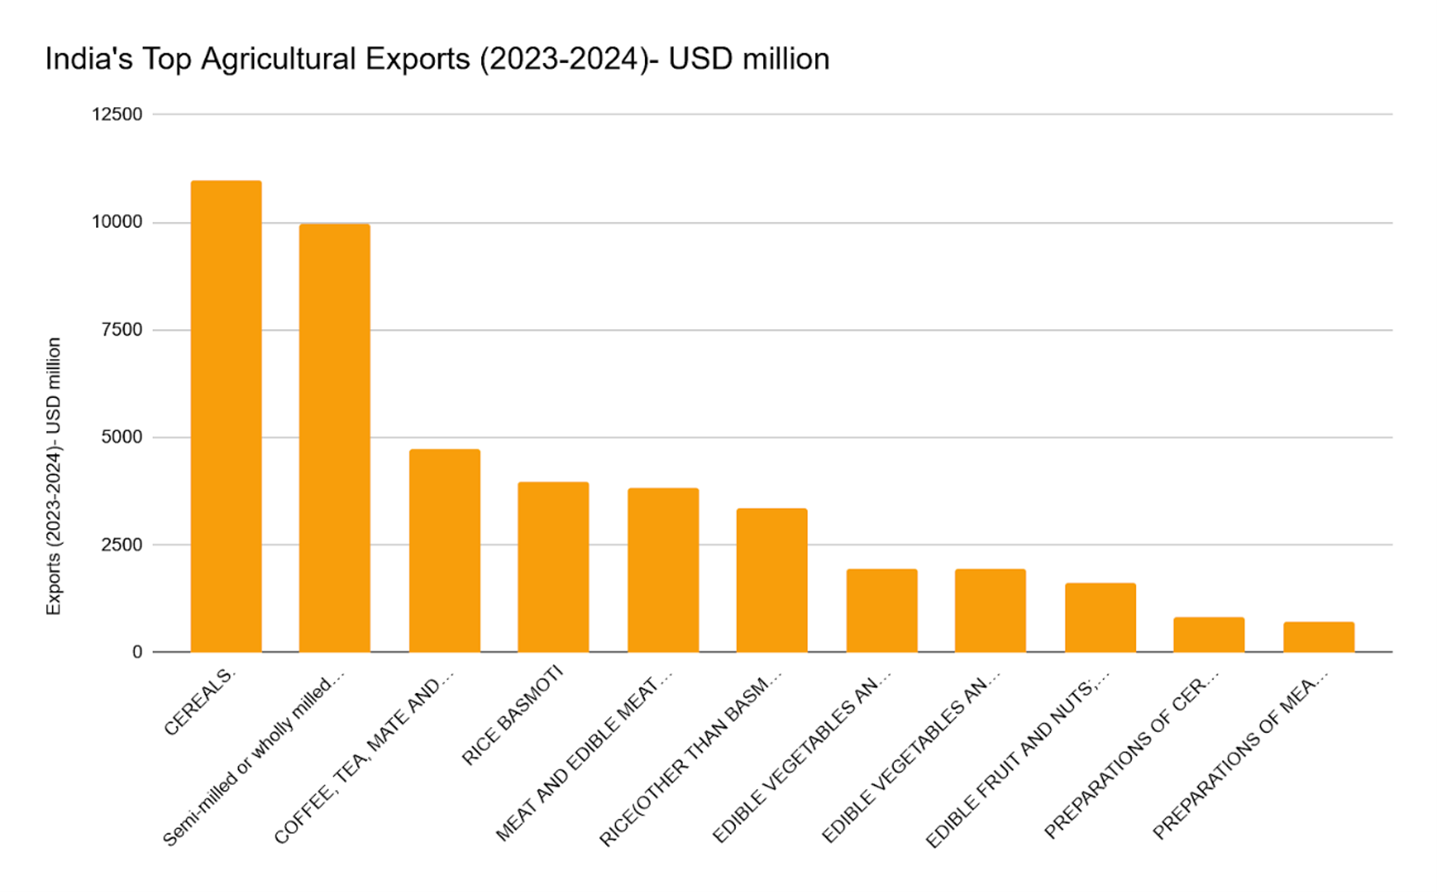
The contribution of agriculture to GDP has declined from 50 per cent in the 1950s to 18.2 per cent in the country’s GDP at current prices in 2024, as the growing economy transitions towards the manufacturing and service sectors2. India is the eighth-largest exporter and seventh-largest importer of agricultural products as of 2022 (Figures 1 and 2)3. India’s share in global agricultural exports stands at 2.2 per cent, and imports at 1.4 per cent4. Rice is the largest exported agricultural product from India and makes for more than 20 per cent of the total agricultural exports. More than half of (51.5 per cent) agricultural exports in 2023 came from just five products, which are rice - basmati and non-basmati, sugar, spices and oil meals5. Rice and sugar alone account for 37.4 per cent of India’s exports.
India’s Agricultural Trade Policies
Soon after India gained independence in 1947, then Prime Minister Jawaharlal Nehru remarked, “everything else can wait, but not agriculture”, in the context of the Bengal Famine of 1942-1943 and the acute food scarcity prevailing in the country10. One of the primary policy interventions in the agriculture sector is the Minimum Support Price (MSP). The liberalisation momentum in agriculture only began with the implementation of the WTO Uruguay Round Agreement on Agriculture (AoA) in 1994. QR on agricultural imports were virtually removed and replaced with tariffs by AoA. India had to phase out the QR in 2000 to improve its balance of payments position. However, import tariffs generally remained high in the sector to ward off foreign competition. During this period, the agricultural policies focused on ending the dependency on imported food grains11. Today, India is the world’s third-largest producer of rice, the second-largest producer of wheat and the largest producer of milk.
India’s Domestic Agricultural Policies: One of the first significant steps in agricultural policy was the establishment of the Agricultural Prices Commission (APC) in 1965, which later evolved into the Commission for Agricultural Costs and Prices (CACP), to advise the government on agricultural price policies. APC recommends Minimum Support Prices (MSPs) for various crops. PDS was established with the objective of ensuring food self-sufficiency by making food grains available to all at an affordable price. Under the Food Corporations Act of 1964, the Food Corporation of India (FCI) was established to ensure the availability of food grains to the poor sections of society. The government procures food grains at the Minimum Support Price (MSP) to maintain buffer stocks and distribute them through the Public Distribution System (PDS). Since the mid-1990s, the PDS system has moved to a more decentralised version where the public sector is responsible for purchasing, movement and storage of food grains in the states. It also transformed into the Targeted Public Distribution System (TPDS), providing subsidised food for the poor sections of society12. MSP is a market intervention by the government that ensures a minimum price, or floor price, for the produce. The MSP scheme for 22 mandated crops remains in place to provide a floor price for their produce. The objective of the price policy shifted from being a risk insurance in the 1980s, to MSP as a remunerative price in the early 2000s.
Impact of Minimum Support Prices (MSP) on Trade
Introduced in the 1960s, MSP was initially intended to encourage farmers to grow staple crops, such as wheat and rice, during the Green Revolution. MSP is a minimum price, set by the government, that is provided to the farmers for their produce.It is the minimum value provided to them against their agri products sold in the market. The first MSP was set for wheat in 1966-67 to ensure ‘fair’ pricing for increased production. Initially, when it was introduced, MSP was presented as a guarantee to farmers, ensuring they would not suffer due to the high yields of new wheat and paddy varieties, as the government would offer a price if the market didn’t. Later, it was extended to other crops as well. However, MSP has led to some distortions in the agricultural market, leading to undiversified production, and ignoring the market logic of demand and supply13.
Since 2006-2007, the public procurement of rice and wheat has doubled, leading to increased buffer stockpiles. Due to these stockpiles, even after procuring more than 50 per cent of the marketed surplus of rice and wheat, the market prices of these crops remained below the MSP in several states. There is also a decreasing trend in the per capita consumption of rice and wheat, as people are increasingly favouring alternative food options14. All these led to a situation where for most farmers, the MSP remains a maximum securable price—almost a dream price15. It leads to a cyclical situation where most farmers prefer to keep producing rice and wheat to secure MSP, leading to market distortion. This also leads to a situation where the market logic is ignored, as the overall demand and supply decide prices. The long-standing practice of procuring the majority of rice and wheat market arrivals at MSP for over five decades, has had a negative impact on farmers’ ability to trade and sell their produce in a free and competitive market.
Within the WTO framework, MSP is considered part of India’s domestic support measures. Since India’s product-specific Aggregate Measurement of Support (AMS) during the period (1986-1988 and 1995-1996) was largely negative, India argues that it can increase the price support measures without breaching the WTO rules16. However, over time, India has been facing pressure from the WTO on the issue of MSP. The WTO blames India for breaching the limit under AoA with excessive MSP support. In November 2024, the WTO communication accused India of providing significant market price support to wheat and rice for 2021-2022 and 2022-202317. In May 2018, a similar paper was issued by the Committee on Agriculture of the WTO, at the request of the US. However, India rebutted the claim, saying that the methodology used for calculating the MSP by the WTO is wrong as India only calculates the portion of production procured by the Government of India, unlike the WTO, which bases their calculation on all eligible production18. India also argues that economic logic suggests negative price support is also distortive, and should be deducted from positive AMS.
The government sets Minimum Support Prices (MSP) for 22 mandated crops, as well as Fair and Remunerative Prices (FRP) for sugarcane. The implementation of MSP involves the Food Corporation of India (FCI) and state government agencies establishing purchase centres, primarily in major producing states, to procure grain at the announced minimum support prices. The implementation of MSP has been mostly confined to four crops, mainly: sugarcane, paddy/rice, wheat and cotton. MSP covers nearly three-fourths of the sugarcane production in the country, 50 per cent for rice and 40 per cent for cotton. Since the government guarantees MSP in these four products, the above-mentioned products make up for more than 22 per cent of the total value of India’s agricultural output, leading to an increasingly undiversified agricultural market.
However, it decreases India’s export potential as higher domestic prices, which can be influenced by MSP, sometimes make Indian exports of bulk products—like sugar, wheat, and rice—less competitive internationally when compared to world prices. Policies like MSP can contribute to higher production costs or market prices within India, making it harder to compete globally19. This has led to a situation where Indian agricultural products are not able to compete globally.
Impact of Agricultural Export Bans
A primary driver behind India’s trade policy, including measures that restrict exports, has been the objective of achieving food security at both national and household levels since independence in 1947, due to the repeated famines India faced. More recently, restrictions have been explicitly aimed at protecting the interests of domestic consumers from the price fluctuations20. While liberalisation efforts began in the 1990s under WTO agreements, export controls like QRs and licensing requirements remained for some products.
For instance, India imposed a ban on the export of non-basmati white rice in 2023 and a ban on the export of broken rice in 2022 to ensure sufficient domestic supplies and control rising food inflation21. India has banned, or allowed export to any country through permits for rice, wheat flour, onion, pulses and sugar. The Minimum Export Prices (MEP) on onions were imposed after the government lifted the export ban in May 2024. MEP is one of the many policy tools used to control India’s exports of food commodities. MEP is a regulatory threshold set by the government to control the lowest price at which goods can be exported, and it is an export control policy tool that the government has been employing to protect consumers from inflationary pressures and ensure an orderly domestic supply by making these products unattractive in the global markets. MEP caps are always higher than the prevailing prices in global markets, thereby disincentivising the export of certain products22. MEP is usually used in products with a particular political-economic significance—such as rice, onions, potatoes and edible oil. These products are such typical staple foods in India that fluctuations and inflation in their prices affect the political climate of India.
However, MEP remains a redundant policy tool as it has unintended consequences that continue to impact the food sector trade23. First, it costs the producers as they lose an opportunity for remunerative prices and disincentivises them to produce more. Second, it disproportionately impacts the small farmers in India as large agri firms have the means and ways not to be affected by the MEP policy by adding agency commission from buying houses, which gets added to the total price quote. Third, MEP and other export restrictions disincentivise most producers to produce more, affecting domestic and international supply while demand continues to sustain. Fourth, India’s employment of MEP impacts international prices, potentially leading to a surge in global prices of these products, given that India is a major exporter of rice and onions. Hence, the MEP policy does not help reduce the domestic inflationary trend, which is the very objective the policy was intended to serve.
Sudden changes in export policy—like the switch from free to prohibited for non-basmati rice and wheat—create uncertainty for international buyers and hinder the development of stable export markets. Table 1 highlights examples of such sudden policy changes.
Occasional food surpluses, resulting from successful production boosted by domestic policies, pose a problem when exports are restricted. This can lead to costly stockholding by government agencies or, if stocks aren’t purchased, a collapse in domestic prices which is detrimental to farmers24. Ultimately, by limiting market access and contributing to domestic market inefficiencies and price volatility (when surpluses cannot be exported), export bans can reduce the potential for farmers to receive the most remunerative prices for their produce, particularly for export-oriented crops.
| Date | Commodity | Policy | Description |
|---|---|---|---|
| 13-14 May 2022 | All Wheat (HS 1001, etc.) | Complete Ban | The government banned exports of all wheat with immediate effect. New shipments were prohibited; however, existing orders backed by letters of credit (ICLCs) issued on or before 13 May were allowed to ship, as were case-by-case government-to-government food aid consignments. |
| 17 May 2022 | All Wheat Consignments | Partial Exemption | DGFT issued Trade Notice No. 07/2022-23 allowing exports of wheat consignments that had been “handed over to Customs” by 13 May 2022. In other words, this was the wheat already in the export channel before the ban could proceed. |
| 9 Sep 2022 | Broken Rice (HS 1006.40.00) | Complete Ban | Export of broken rice prohibited. The DGFT amended the export policy from “free” to “prohibited” for broken rice (HS 1006 40 00), effective 9 Sep 2022. (Short-term relief was offered for shipments already loaded, or cleared at the port by that date.) |
| 20 Jul 2023 | Non-Basmati White Rice Semi/Wholly Milled, ex-parboiled | Complete Ban | Ban on non-basmati white rice exports. The government prohibited exports of non-basmati white rice (whether polished or not) with immediate effect on 20 July 2023, citing rising domestic prices. (Parboiled rice was explicitly exempted.) |
| 25 Aug 2023 | Basmati Rice | MEP Imposed (USD1200) | MEP set at USD1200/ton. A floor price of USD1200 per tonne was imposed on basmati rice exports, effective 25 August 2023 (to discourage low-price exports). |
| 26 Oct 2023 | Basmati Rice | MEP Reduced (USD950) | Basmati MEP lowered. The basmati rice MEP was reduced to USD950/tonne on 26 October 2023 (down from USD1200) following exporter demand. |
| 13 Sep 2024 | Basmati Rice | MEP Removed | Basmati MEP removed. The government rescinded the minimum export price for basmati rice (previously USD950/tonne) by order on 13 September 2024, allowing free export pricing. |
| 27 Sep 2024 | Parboiled Rice | Export Duty Cut | Parboiled rice duty cut. Export duty on parboiled (steam-processed) rice was cut from 20 per cent to 10 per cent with effect from late September 2024 (notification published 27 Sep 2024). |
| 28 Sep 2024 | Non-Basmati White Rice | Ban Lifted (with MEP) | NBW exports resumed (with a floor price). India allowed exports of non-basmati white rice to resume, but with a new floor price (MEP) of USD490/ton. This lifted the 2023 ban but ensured shipments were not underpriced. |
| 22 Oct 2024 | Parboiled Rice | Export Duty Removed | Parboiled rice duty abolished. Following the earlier cut to 10 per cent, the export duty on parboiled rice was completely removed on 22 October 2024, making parboiled rice exports duty-free. |
| 22 Oct 2024 | Paddy (in-husk) & Husked Brown Rice | Export Duty Removed | Duties on paddy and brown rice abolished. The 10 per cent export duty on rice paddy (in husk) and on husked (brown) rice was eliminated as of 22 Oct 2024, rendering exports of these forms duty-free. |
| 22 Oct 2024 | Non-Basmati White Rice | MEP Removed | NBW floor price removed. The USD490/tonne minimum export price on non-basmati white rice was rescinded effective 22 Oct 2024, fully lifting export curbs on common rice. |
Impact of Import Tariffs and Non-Tariff Barriers
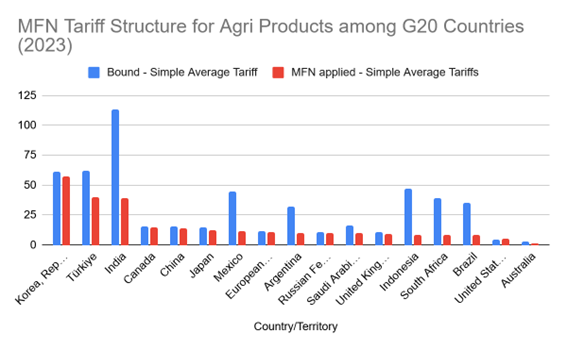
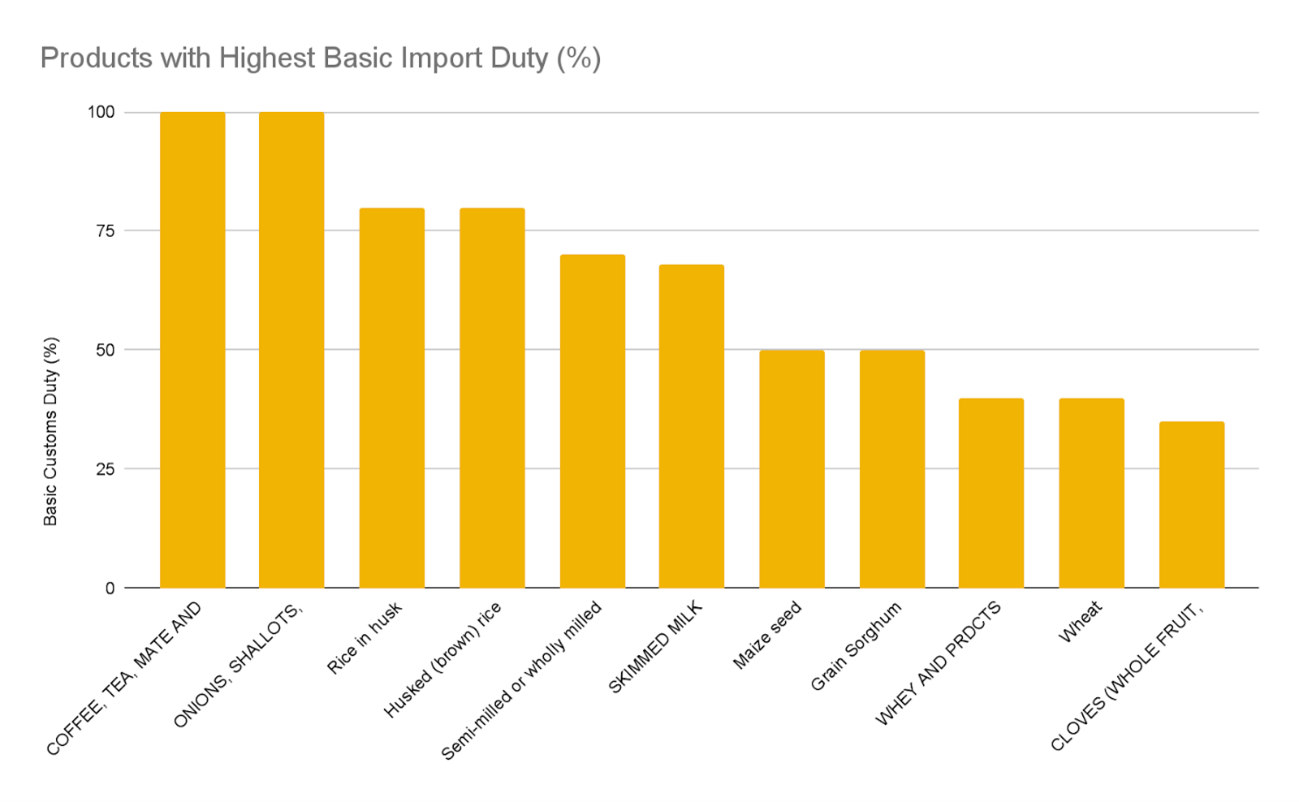
India maintains one of the highest tariff structures among the G20 group of countries (Figure 5). India’s average Most-Favoured Nation (MFN) rate on agricultural goods stood at nearly 37 per cent in 2024. India’s import duty for rice has been kept at 70 per cent, despite India being the largest producer of rice (Figure 6). Within agriculture, alcohols and wines run the highest tariff differential of around 122 per cent—followed by dairy products, fish, meat, frozen, processed, and live animal products (Figure 6) (To view the detailed list of tariffs against agricultural products, see Appendix). These high tariffs keep Indian agricultural imports expensive—such as for products like edible oils, high-value nuts and wine—with steep tariffs (often above 60 to 100 per cent). This limits consumers’ choice and raises input costs for food processors. High tariffs make it difficult to secure reciprocal tariff elimination in free trade agreements negotiations, as India offers little on agriculture.
India’s agricultural trade policy is shaped as much by non-tariff barriers as it is by high import duties26. These barriers take many forms. Some are outright bans, such as those on certain animal fats and oils. Others involve licensing requirements for specific livestock products or government-controlled imports under Tariff Rate Quotas (TRQ), as in the case of corn. In several instances, the restrictions are rooted in cultural and religious considerations; for example, India prohibits dairy imports from animals fed with organs or blood meal27. Over time, the government has added further hurdles for foreign dairy producers, introducing new health certification requirements and mandatory facility registration.
TRQs have become a favoured tool for managing sensitive imports. The India–Australia Economic Cooperation and Trade Agreement (ECTA), for instance, allows limited quantities of lentils, almonds, and oranges at low in-quota tariffs, while keeping much higher duties on anything above the quota28. In practice, the quota volumes are too small to make a dent in domestic prices, serving more as a political gesture than a pathway to genuine market opening. However, this could lead to rent-seeking behaviour in the market, favouring large trading houses over smaller players, undermining the broader benefits that FTAs are supposed to deliver.
Sanitary and Phytosanitary (SPS) rules and Technical Barriers to Trade (TBT) form another significant layer of control. The Department of Animal Husbandry and Dairying (DAHD) and the Food Safety and Standards Authority of India (FSSAI) require strict veterinary health certificates for imports of milk, dairy products, and live animals. From September 2024, all foreign establishments wishing to export to India must be registered with the FSSAI and obtain a Unique Registration Number29. These measures, combined with port-specific entry conditions and facility approval lists, make compliance costly—especially for small and medium-sized exporters. Even when tariffs are reduced through FTAs, slow recognition of foreign laboratories and testing protocols can make real access elusive. FSSAI also enforces rules on food additives, labelling formats, nutritional disclosures, and Maximum Residue Limits (MRLs), and often restricts certain novel ingredients altogether30.
Livestock and meat imports face their own regulatory hurdles. Under the Livestock Importation Act of 1898, importing live animals, breeding stock, or certain meat products requires navigating highly restrictive conditions. Rules prohibiting feed made with animal proteins increase feed costs and limit access to high-protein feed ingredients. This keeps the livestock sector less competitive internationally and discourages investment in productivity improvements, leaving India’s per-animal yields far behind those of advanced producers.
Biotechnology policy adds another layer of constraint. While India approved Genetically Modified (GM) cotton in 2002, it has not cleared any new GM cotton varieties since 2008, and approvals for food and feed crops such as soybean, maize, and canola have been stalled. Regulatory decisions lie with the Genetic Engineering Appraisal Committee (GEAC) under national and judicial oversight, and a 2024 Supreme Court directive has called for a broad, consultative approach to GM policy. The implications for trade are significant: major exporters like the US and Brazil sell large volumes of GMO soy and maize for animal feed, yet India’s reluctance to import them keeps domestic feed costs high and limits sourcing options for its poultry and livestock sectors. When such imports are allowed, they typically take the form of processed products—such as degummed oils or soymeal—from carefully vetted suppliers. This cautious approach, however, also slows the adoption of higher-yielding, pest-resistant crop varieties at home, which means India’s productivity gap with global competitors remains stubbornly wide.
India’s Attempt at Agriculture Liberalisation
India’s agricultural liberalisation momentum only began with the implementation of the WTO Uruguay Round Agreement on Agriculture (AoA) in 1994. The key pillars of AoA were market access, domestic support and export subsidies.
Market Access
The key element of AoA was the tariffication of all non-tariff barriers, which means all the non-tariff barriers, such as quotas and minimum import prices, were to be removed and converted to equivalent tariffs33. Also, under the Uruguay Round, India bound 81 per cent of its agricultural tariffs.
Simple mean bound rate is the unweighted average of all the lines in the tariff schedule in which bound rates have been set. Bound rates result from trade negotiations incorporated into a country’s schedule of concessions and are thus enforceable.
Initial bound rates ranged from 100 per cent for commodities, 150 per cent for processed products, and 300 per cent for some edible oils. The simple average bound tariff rate was around 116 per cent. For products where tariffs had not been previously bound under any trading agreements, developing countries could fix the agreed maximum tariffs or ceiling bindings without any obligation to reduce them during the implementation period.
In the WTO, when countries agree to open their markets for goods or services, they “bind” their commitments. For goods, these bindings amount to ceilings on customs tariff rates.
After signing the AoA too, India maintained QRs through import prohibitions, import licensing or canalised imports for roughly 43 per cent of the agricultural tariff lines (606 out of 1398)34. For 262 of these products, the restrictions were based on security, religious and environmental considerations (such as the feed given to cows must not have any meat in it), while the balance-of-payments exception under GATT Article XVIII: B was invoked for the others. India agreed to the WTO in 1999 to phase out all QR, completely removing them by April 2001, and replace them with bound tariffs.
India uses the flexibility afforded by the AoA, particularly the margin between bound and applied tariffs and the structure of domestic support commitments (especially the large negative product-specific AMS and differential treatment provisions), to continue prioritising food security and protecting domestic producers. The ability to raise applied tariffs allows regulation of imports to influence domestic prices, a key tool for price stabilisation. Some products had zero bound rates from earlier GATT rounds, including rice and dairy products (1947), maize and millet (1951), sorghum (1962), soybean and rapeseed oil (1979). With the removal of QR, there were apprehensions that imports of these zero-bound commodities could increase. India initiated negotiations under GATT Article XXVIII to raise these bound rates. In the course of these re-negotiations, India was granted some concessions, leading to the establishment of TRQ for five commodities which allow a minimum market access quantity at minimal or low tariff rates, while a much higher rate applies to trade above that quota limit35.
Domestic Support and Export Subsidies
In the area of domestic support, India had in place a price intervention scheme and input subsidies, both of which came under the purview of the AoA. As per AoA, for domestic support prices, the total support given from 1986 to 1988—measured by the Total Aggregate Measure of Support (AMS)—should be reduced by 20 per cent in developed countries and 13.3 per cent in developing countries. The ‘Green Box’ policies, which have little trade-distorting effect, are excluded from any reduction commitments. India’s total AMS was (-) 2.4 billion during the 1986 to 1988 period. India’s AMS is negative, which means that, on average, the policies in that period were not subsidising production but actually penalising or taxing producers relative to a reference world price. This happened because, at that time, India often set procurement prices below international reference prices, effectively keeping domestic farm-gate prices lower than what farmers could have earned from exports. Since it was negative, India has not committed to any reduction agreements. India’s non-product-specific AMS was 7.52 per cent, and product-specific AMS at (-) 38.47 per cent of the total value of production, keeping aggregate AMS below the de minimis level of 10 per cent36. Owing to that, India was not required to make any binding reduction commitments on trade-distorting support in its WTO Schedule. This allowed India to expand support through policies like MSP and input subsidies without breaching the WTO commitments.
At the time of signing the AoA, India had no export subsidies other than those exempted for developing countries. However, under the provisions of AoA, developing countries can provide subsidies to reduce the cost of marketing exports and internal transports. India has not notified the WTO of any such subsidies, although the Government of India provides income tax exemptions on profits from export sales and interest subsidies.
Hence, the AoA made very little attempt to reform India’s agriculture sector. The only policy shift was in establishing ceiling bindings.
Agriculture and Free Trade Agreements
Free Trade Agreements (FTA) aim to build coherence between different regulatory instruments and broaden cooperation. It integrates economies and helps to bring potential gains through increased trade collaborations, Foreign Direct Investment (FDI), productivity, market size, and competitiveness. It dismantles trade barriers and pushes the countries towards higher trade liberalisation. However, the restrictive policies and protectionist stances of the countries, especially in the agricultural trade sector, have remained a challenge for FTA. For example, the North American Free Trade Agreement (NAFTA) has highly reduced trade barriers and increased agri-trade37. Canada’s agri-exports to the United States increased significantly due to low non-tariff barriers there.
However, India’s approach toward liberalising the agriculture sector has been selective and protectionist, especially for sensitive commodities such as rice, wheat, dairy, sugar and oils (Refer Table 1). In India, the applied tariffs were often lower than bound rates but could be adjusted based on domestic market conditions and world prices. This flexibility in adjusting applied tariffs is a trade tool used for regulating imports and influencing domestic prices. Along with these domestic policies, India’s FTAs reveal a consistent pattern of very narrow commitments in the agriculture and dairy sectors.
India’s FTA Commitments in Agriculture
India has excluded dairy products from import concessions in almost all FTAs. India has maintained Special Safeguard Measures (SSMs) and applies in-quota tariffs for certain sensitive agricultural items. In most of the FTAs that India is part of, India has maintained an exclusion list to protect most of its agricultural products. Across deals with ASEAN, Japan, Korea, Australia, the UAE, and others, the agricultural chapters are built around exclusion lists, small TRQs, and safeguards rather than sweeping market openings.
For example, the ASEAN–India Trade in Goods Agreement phased in tariff cuts on some lines but kept politically sensitive items like palm oil, coffee, pepper, and tea out of scope. Similarly, the India–Japan and India–Korea CEPAs excluded most dairy products, cereals, and fresh produce, while the Australia–India ECTA gave Canberra TRQ-based access for almonds, lentils, and certain fruits—volumes that are modest relative to India’s domestic demand. These quotas are active and managed by government authorities, but their limited scale means they have little effect on price convergence or structural competition.
| FTA | Signed Year | Agri-Related Clauses |
|---|---|---|
| Australia-India Economic Cooperation and Trade Agreement (AI ECTA) | 2022 | With agreement, a 30 per cent tariff will be eliminated on Australia’s sheep meat in India. India retains safeguards on items like cotton. and allows only Australian-grown produce preferential access. |
| India-ASEAN FTA | 2009 | India has excluded many farm products from this agreement, including: crude/refined palm oil, coffee, pepper and tea, which were kept as special products. India’s “exclusion list” (no cuts) includes staples and perishables – e.g. rice, fruits, vegetables, spices, oilseeds, dairy products, etc. |
| SAFTA (South Asian FTA) | 2004 | Each country in the agreement maintained an exclusion list with many agri items protected from the agreement. India’s SAFTA list (2006) covers staples & perishables: e.g. rice, wheat, pulses, onions, tomatoes, potatoes, garlic, fruits, dairy, meat, etc. |
| India-Japan CEPA | 2011 | India’s negative list excludes many food items. India’s exclusions include marine products, dairy, fruits, vegetables, spices & nuts, cereals, vegetable oils and processed foods (sugar, juice, liquor), tobacco, etc. |
| India-Korea CEPA | 2009 | India’s exclusion list covers key agriculture products: poultry, dairy, fruits, vegetables, spices, nuts, cereals, vegetable oils, processed agri (sugar, juice, liquor). |
| India-Singapore CECA | 2005 | Fifty-six per cent of tariff lines were excluded for India. These excluded items included the most protected sectors (likely many agricultural products). In effect, Singapore got full access; India retained high duties on most of its sensitive items (including many farm goods). |
| India–Sri Lanka FTA (ISFTA) | 1999 | India’s exclusion list includes several agri categories: e.g. edible fruit and nuts, beverages, spices. Sensitive agri items were phased out over 10–15 years or remain protected. |
| India-UAE CEPA | 2022 | UAE immediately lifted duties on major Indian staples (e.g. rice, sugar, dairy, onions), while India liberalised imports of some UAE products (e.g. dates, fruits). |
| India-Malaysia CECA | 2022 | India offered 76 “ASEAN-plus” tariff concessions (largely fruits, cocoa, textiles) to Malaysia. Malaysia offered 140 items to India (notably basmati rice, mangoes, eggs, cotton garments, etc). Tariffs are eliminated on many items and cut to 5 per cent on others, with some safeguards in place. |
| India-Mauritius CECPA | 2021 | Agricultural trade is mostly liberalised (e.g. Mauritius-dependent economy gets duty-free exports). |
| India-Chile PTA | 2006 | India offered tariff preferences (10–50 per cent) on 178 lines (mainly meats, fish, salt, copper ore, chemicals, leather, wool, etc). Chile offered preferences on 296 lines (10–100 per cent) – mostly industrial products, with only seven agricultural lines. Thus, a few Chilean farm exports benefit. |
| India-MERCOSUR PTA | 2004 | India’s offer list (450 items) focuses on industrials and some meats. MERCOSUR’s list (452 items) includes some food and oils (“food preparations, essential oils, etc.”). Agri concessions are modest; e.g. some fruits and oils. |
| India-Afghanistan PTA | 2003 | This agreement grants Afghanistan duty-free access to a few Indian goods (tea, sugar, medicines). India offers preferential rates on many Afghan exports: most dried fruits and nuts (raisins, apricots, mulberries, pistachios, almonds, walnuts) and some fresh fruits (grapes, melons, apples, pomegranates) are given 50 per cent of MFN duty (remaining items face a higher tariff). |
Agriculture Contentions in the Ongoing Trade Negotiations
India’s cautiousness in opening up its agriculture and dairy sector is being tested in ongoing trade talks with the EU and the US. Agriculture remains a central demand for both the EU and the US, and they are seeking tariff-free access for their globally competitive products.
For the EU, that means dairy (particularly cheeses), wines, processed meat, and temperate fruits. For the US, the priority is farm commodities like almonds, apples, pulses, and feed ingredients such as soy and maize—often genetically modified, which India currently restricts39. The challenge for India is that its average Most-Favoured-Nation (MFN) tariff on agricultural goods—at around 37 per cent—is among the highest in the G20, with specific duties for products like rice (70 per cent), dairy (30–60 per cent), and alcohols and wines (over 120 per cent). These tariffs have long shielded domestic producers from price competition but also insulated them from the productivity pressures that trade openness can bring.
The US has long been one of India’s most important markets for agricultural and allied exports. In 2022, it ranked as the second-largest destination by value, taking in goods worth USD3.69 billion from India. But the agricultural trade relationship is far from balanced in terms of market access. India maintains some of the highest agricultural tariffs in the world, a simple average rate of 39 per cent and a trade-weighted average of 65 per cent, compared with the US’s modest 5 per cent and 4 per cent, respectively40. This stark contrast reflects India’s highly protectionist stance in agriculture. Agricultural goods make up roughly 7 per cent of India’s total imports and 9 per cent of total exports.
On the US side, farm exports are dominated by bulk commodities such as soybeans (USD30 billion in 2023), maize (USD17.2 billion), wheat (USD7.3 billion) and rice (USD1.9 billion), much of which is shipped to China, Mexico, the EU, and Japan41. Its top agricultural imports include alcoholic beverages, bananas, and other fruits and berries. For India, agricultural trade with the US is also significant—in 2023, India enjoyed an agricultural trade surplus of USD3.46 billion. Its key exports to the US include frozen shrimp and prawns, basmati and non-basmati rice, vegetable saps and extracts, natural honey, and a variety of processed foods. In return, the US is a major supplier of almonds, cotton, denatured ethyl alcohol, crude soybean oil and pistachios. Lowering tariffs on some of these imports could become a bargaining chip for India in securing a broader trade agreement with Washington.
Agriculture is a priority for US trade negotiators, who are actively seeking larger markets for their farm products in India42. However, India’s high tariffs have remained a significant obstacle. Farmers’ groups in India have resisted the opening of the agricultural sector, concerned about the impact on their incomes. Some of the US’s largest agricultural exports, such as genetically modified soybeans and corn, face strict restrictions in India. Fresh apples—once subject to a steep 50 per cent duty—saw this reduced to 15 per cent after recent talks, showing that selective liberalisation is possible. Still, key products remain heavily protected: skimmed milk powder (SMP) carries a 60 per cent duty, while fresh dairy products such as cheese and curd are taxed at 30 per cent. Cereal preparations, including corn flakes and breakfast cereals, attract a 30 per cent tariff.
What Can India Do to Open Up?
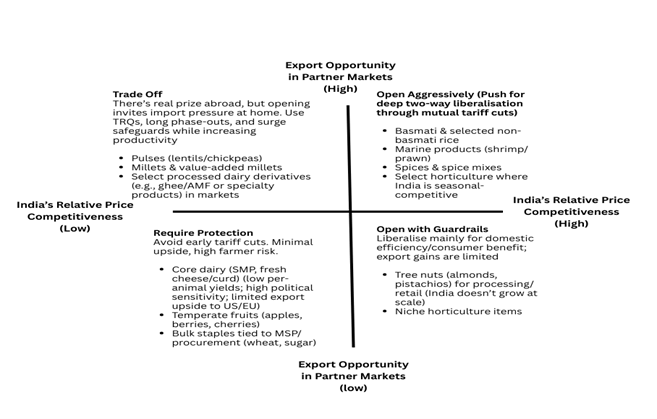
Going forward, there is scope for India to open up in carefully chosen areas without undermining domestic farmers’ interests. For instance, India is already one of the world’s largest importers of edible oils. India sources its palm oil from Indonesia and Malaysia, and soybean oil from Argentina and the US. Here, lower tariffs could ease consumer prices and reduce input costs for food processors without seriously threatening domestic oilseed farmers, who already compete with imports. Similarly, in rice, particularly basmati, India enjoys a clear comparative advantage. India is the world’s largest exporter of both basmati rice (USD9.9 billion in 2023) and non-basmati rice (USD10.4 billion), and enjoys a clear comparative advantage in these products. The clearest wins are in sectors where India is already a world leader. Cutting tariffs abroad and fixing SPS bottlenecks would allow exporters to sell even more into the US and EU without threatening domestic farmers. The same goes for shrimp and prawns, which form the backbone of India’s farm trade surplus with the US, and for spices and guar gum, where India enjoys entrenched global dominance. These are areas where India can confidently push for deeper market access abroad while offering limited, low-risk concessions at home. Liberalisation could secure reciprocal market access for Indian rice exporters in high-income markets while posing little threat to domestic producers, given India’s cost competitiveness and brand recognition. Onions also fall into this category of “safe to liberalise” goods, where India can compete strongly (Figure 7). Likewise, nuts such as almonds and pistachios are not grown in large quantities domestically, so reducing duties poses little risk to Indian farmers. Liberalising such goods could be smart bargaining chips to secure reciprocal access for India’s export champions like rice and seafood.
However, dairy will be a highly politically sensitive sector to open up, in general. India’s dairy sector is highly protective, with 30 to 40 import tariffs. European and New Zealand producers benefit from high-yield herds, strong cold-chain infrastructure, and export subsidies, which allow them to supply milk solids at prices often below Indian production costs. However, within the dairy sector, whey protein and cheese could be opened up as India has limited competence in those products. In import-competing staples with high MSPs, tariff cuts could create price clashes. In inputs and processed goods, lower tariffs would likely strengthen downstream industries and benefit consumers through lower retail prices. Where India is competitive, liberalisation could expand export volumes and encourage investment in processing, branding, and logistics.
Conclusion
India’s agricultural policy in its practical sense has been guided by protection and market interventions, with 39 per cent tariffs on average, as high as 60 per cent on dairy and 45 per cent on edible oils. India also routinely uses export bans and Minimum Export Prices (MEPs) to control supplies. These measures have kept domestic prices low and are intended to protect many farmers; however, it has distorted trade.
More than half of India’s export earnings come from just five products (basmati and non‑basmati rice, sugar, spices and oilseeds). Abrupt policy shifts (export bans on rice and wheat) have repeatedly disrupted markets and hurt farmers’ confidence. Non-tariff factors (such as quality standards and weak logistics) further hamper competitiveness in the global market. WTO disputes over domestic subsidies (rice and wheat stockholding) and sugar demonstrate the international pressure India faces for its protective policies. India has over a dozen FTAs, but agriculture in these deals remains largely protected by excluding staples (rice, wheat, pulses, sugar, dairy) from deep tariff cuts, while offering concessions on lower-value items (certain fruits, vegetables, spices, processed foods). This cautious approach has yielded limited export diversification and has affected trade competitiveness.
Disclaimer: Tables in this document were compiled with the assistance of AI. Please download the document to see Appendix.
Footnotes
Press Information Bureau, Government of India. Agriculture Sector Has Registered an Average Annual Growth Rate of 4.18 per Cent Over the Last Five Years: Economic Survey. PIB Release, July 22, 2024.↩︎
Press Information Bureau. “Press Release.” Government of India.↩︎
World Trade Organization. World Trade Statistical Review 2023. Geneva: WTO, 2023.↩︎
Parliament of India. “Annexure AU850.”↩︎
Global Trade Research Initiative. “Flagship Report.”↩︎
World Trade Organization. World Trade Statistical Review 2023. Geneva: WTO, July 2023.↩︎
World Trade Organization. World Trade Statistical Review 2023. Geneva: WTO, July 2023.↩︎
Ministry of Commerce and Industry, Government of India. “Export Products (Agriculture).↩︎
Ministry of Finance, Government of India. Economic Survey 2000–01: Chapter 8.↩︎
Agriculture Cannot Wait. M S Swaminathan.↩︎
Ministry of Statistics and Programme Implementation. Statistical Year Book, India – Agriculture Chapter.↩︎
Kumar, Pradhuman, and Mittal, Surabhi. “Agricultural Price Policy.” NABARD Paper.↩︎
Food and Agriculture Organization. Agriculture: Towards 2010.↩︎
Mishra, Ayush. “Beyond MSP: Rethinking India’s Age-Old Procurement Policy.” ResearchGate, 2024.↩︎
Frontline (The Hindu). “MSP: A Question of How, Not Why.” April 2024.↩︎
World Trade Scanner. “India for Pulses under WTO Lens.”↩︎
Ministry of Agriculture and Farmers’ Welfare. Annual Report 2023–24. Government of India.↩︎
International Food Policy Research Institute. “India’s Export Restrictions on Rice Continue to Disrupt Global Markets, Supplies, and Prices.” IFPRI Blog, 2023.↩︎
“Minimum Export Price Caps Agricultural Exports.” Economic and Political Weekly 58, no. 17 (2023).↩︎
Suresh, Anisree. “The Onion and Basmati Rice Story: Does India Need a Minimum Export Price?” Moneycontrol, 2024.↩︎
Joseph Glauber and Abdullah Mamun. “India’s Export Restrictions on Rice Continue to Disrupt Global Markets, Supplies, and Prices.” International Food Policy Research Institute (IFPRI), February 7, 2024.↩︎
Ram Singh and Dhriti Mukherjee Pipil. “‘Minimum Export Price’ Caps on Agricultural Exports: A Redundant Policy Instrument?” Economic and Political Weekly 58, no. 17 (April 29, 2023).↩︎
Suresh, Anisree. “The Onion and Basmati Rice Story: Does India Need a Minimum Export Price?” Moneycontrol, 2024.↩︎
Food and Agriculture Organization of the United Nations. Agriculture, Trade and Food Security Issues and Options in the WTO Negotiations from the Perspective of Developing Countries: Volume II, Country Case Studies. Commodities and Trade Division, FAO, 2000.↩︎
OpenAI. “India Rice and Wheat Export Bans and Restrictions (2022–2024).” ChatGPT Shared Content.↩︎
Gulati, Ashok; Harsh Wardhan; Sulakshana Rao; and Tanay Suntwal. Trump’s Tariff Threat: Likely Impact on India’s Agriculture Trade. Policy Brief 36. Indian Council for Research on International Economic Relations (ICRIER), 2025.↩︎
Department of Animal Husbandry and Dairying, Government of India. “Veterinary Health Certificate.” July 2024.↩︎
Department of Agriculture, Government of Australia. “Import Advisory Notice, 2025.↩︎
Department of Animal Husbandry and Dairying, Government of India. “Veterinary Health Certificate.”↩︎
Agricultural and Processed Food Products Export Development Authority. “Market Report: IR Standards.”↩︎
World Trade Organization. Tariff Profiles List. Geneva: WTO.↩︎
World Trade Organization. India Tariff Profile (PDF). Geneva: WTO.↩︎
Ministry of Commerce and Industry, Government of India. “WTO Agreement on Agriculture.”↩︎
Kumar, Chandan. “Strategies for Free Trade Agreements in Agricultural Trade: Evidence from India.” ResearchGate, 2024.↩︎
Connell, Peter; Shirshore Hagi Hirad; and Nilufar Jahan. Indian Agriculture: Trends, Trade and Policy Reforms. Australian Commodities 11, no. 4 (December 2004). Australian Bureau of Agricultural and Resource Economics and Sciences (ABARES), Department of Agriculture, Fisheries and Forestry, Australia↩︎
Kumar, Chandan. “Strategies for Free Trade Agreements in Agricultural Trade: Evidence from India.” ResearchGate, 2024.↩︎
Bilaterals.org. “US–India Trade Talks Underway: Farm Sector.”↩︎
OpenAI. “India’s Agricultural Trade Liberalization Scenarios (2023–2025).” ChatGPT Shared Content.↩︎
“Agricultural Exports and Trade Policy Responses.” Economic and Political Weekly 59, no. 46 (2024).↩︎
Gulati, Ashok; Harsh Wardhan; Sulakshana Rao; and Tanay Suntwal. Trump’s Tariff Threat: Likely Impact on India’s Agriculture Trade. Policy Brief 36. Indian Council for Research on International Economic Relations (ICRIER), 2025.↩︎
Kumar, Chandan. “Strategies for Free Trade Agreements in Agricultural Trade: Evidence from India.” HRC Journal of Economics and Finance 2, no. 2 (April–June 2024).↩︎
Bilaterals.org. “US–India Trade Talks Underway (Farm).” Bilaterals.org.↩︎